

Beach Nourishment 29.4 Design and Prediction Approaches and Methods 641
Part C | 29.4
shorelines can only be predicted with some success if
the initial shorelines are significantly out of equilibrium such as due to a nourishment project or a feature
(such as a groin) is present that interrupts the longshore sediment transport. In the usual case in which
shoreline erosion was occurring prior to the nourishment, this must be accounted for in the performance
predictions.
Prior to designing a beach nourishment project, it is
very helpful to try to understand the cause and magnitude of the erosion leading to the need. The cause
may or may not be apparent. In most cases, nourishment will not correct the cause, so best estimates are
that the project will continue to erode at a more-or-less
predictable rate equal to the sum of the project-related
evolution rate and the historic rate.
There are several levels of methodologies or models
that can be applied to performance prediction. These
range from an analytical model to one-line numerical
models to advanced three-dimensional models. Oneline models track only one contour of the profile,
usually mean sea level, or some other contour representing the shoreline. Each of these model types can
play a useful role in design and prediction.
29.4.1 Pelnard Considère Methodology
The simplest approach, that of Pelnard Considère
(P-C) [29.6], is analytical and is useful for developing
a basic understanding of the interrelationships between
the design variables including project length, wave
height, and sand transportability. Relatively simple oneline numerical models provide flexibility not available
in the analytical models. The more advanced models
provide greater detail than the other two levels. Due to
the simplicity of the P-C approach, it is suggested that,
if applicable, it be applied in conjunction with one of
the other two more advanced level models. All models
include a transport equation and a conservation of sediment equation.
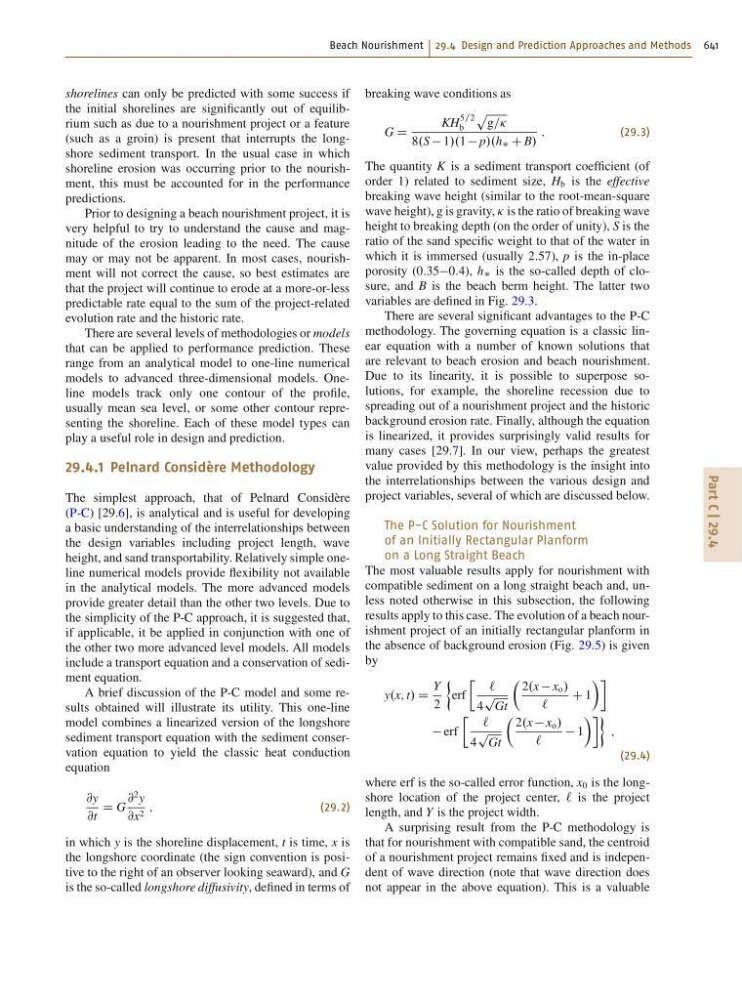
A brief discussion of the P-C model and some results obtained will illustrate its utility. This one-line
model combines a linearized version of the longshore
sediment transport equation with the sediment conservation equation to yield the classic heat conduction
equation
@y
@t
D G
@
2 y
@x 2 ;
(29.2)
in which y is the shoreline displacement, t is time, x is
the longshore coordinate (the sign convention is positive to the right of an observer looking seaward), and G
is the so-called longshore diffusivity, defined in terms of
breaking wave conditions as
G D
KH
5=2
b
p
g=Ä
8.S 1/.1 p/.h C B/
:
(29.3)
The quantity K is a sediment transport coefficient (of
order 1) related to sediment size, H b is the effective
breaking wave height (similar to the root-mean-square
wave height), g is gravity, Ä is the ratio of breaking wave
height to breaking depth (on the order of unity), S is the
ratio of the sand specific weight to that of the water in
which it is immersed (usually 2:57), p is the in-place
porosity (0:350:4), h is the so-called depth of closure, and B is the beach berm height. The latter two
variables are defined in Fig. 29.3.
There are several significant advantages to the P-C
methodology. The governing equation is a classic linear equation with a number of known solutions that
are relevant to beach erosion and beach nourishment.
Due to its linearity, it is possible to superpose solutions, for example, the shoreline recession due to
spreading out of a nourishment project and the historic
background erosion rate. Finally, although the equation
is linearized, it provides surprisingly valid results for
many cases [29.7]. In our view, perhaps the greatest
value provided by this methodology is the insight into
the interrelationships between the various design and
project variables, several of which are discussed below.
The P-C Solution for Nourishment
of an Initially Rectangular Planform
on a Long Straight Beach
The most valuable results apply for nourishment with
compatible sediment on a long straight beach and, unless noted otherwise in this subsection, the following
results apply to this case. The evolution of a beach nourishment project of an initially rectangular planform in
the absence of background erosion (Fig. 29.5) is given
by
y.x; t/ D
Y
2
erf
Ä `
4
p
Gt
Â
2.x x o /
`
C 1
ÃÃ
erf
Ä `
4
p
Gt
 2.x x o /
`
1
ÃÃÃ
;
(29.4)
where erf is the so-called error function, x 0 is the longshore location of the project center, ` is the project
length, and Y is the project width.
A surprising result from the P-C methodology is
that for nourishment with compatible sand, the centroid
of a nourishment project remains fixed and is independent of wave direction (note that wave direction does
not appear in the above equation). This is a valuable