

Beach Nourishment 29.3 Role of Structuresin Beach Nourishment 639
Part C | 29.3
t´ =
16 Gt
l
2
0
1
t´ = 0
t´ = 0.04
t´ = 0.11
t´ = 1
t´ = 4
t´ = 16
2
3
4
y /Y
x /(l/2)
100
80
60
40
20
0
Note:
Shoreline positions are
symmetric about x/(l/2) = 0
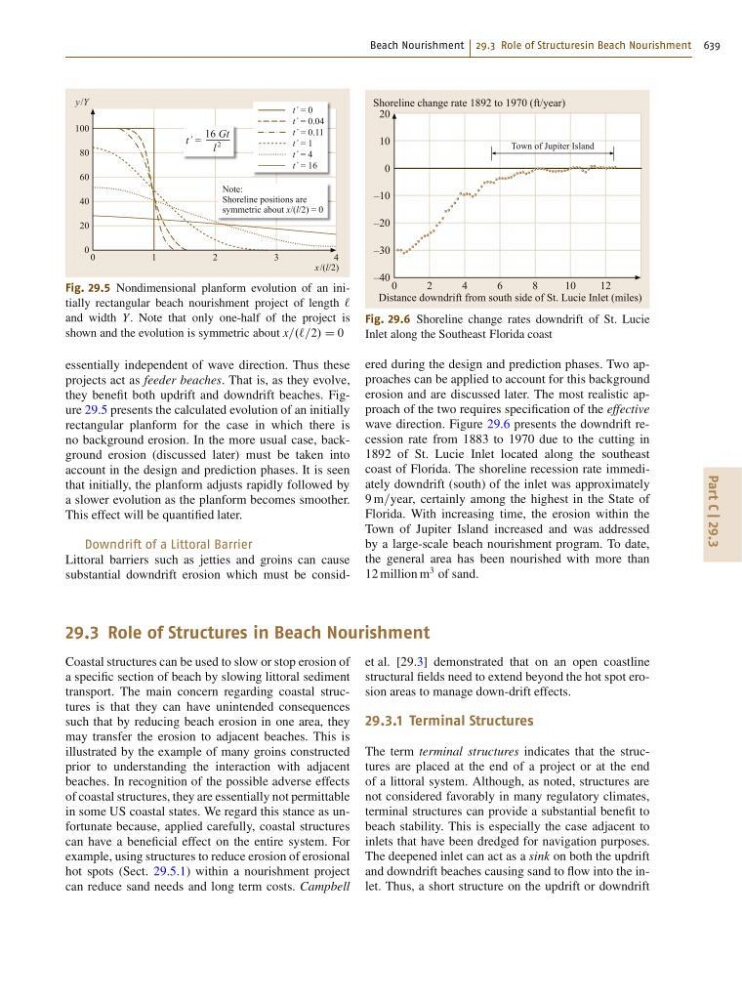
Fig. 29.5 Nondimensional planform evolution of an initially rectangular beach nourishment project of length `
and width Y. Note that only one-half of the project is
shown and the evolution is symmetric about x=.`=2/ D 0
essentially independent of wave direction. Thus these
projects act as feeder beaches. That is, as they evolve,
they benefit both updrift and downdrift beaches. Figure 29.5 presents the calculated evolution of an initially
rectangular planform for the case in which there is
no background erosion. In the more usual case, background erosion (discussed later) must be taken into
account in the design and prediction phases. It is seen
that initially, the planform adjusts rapidly followed by
a slower evolution as the planform becomes smoother.
This effect will be quantified later.
Downdrift of a Littoral Barrier
Littoral barriers such as jetties and groins can cause
substantial downdrift erosion which must be consid0
2
4
8
Town of Jupiter Island
6
1 0
1 2
Shoreline change rate 1892 to 1970 (ft/year)
Distance downdrift from south side of St. Lucie Inlet (miles)
20
10
0
–10
–20
–30
–40
Fig. 29.6 Shoreline change rates downdrift of St. Lucie
Inlet along the Southeast Florida coast
ered during the design and prediction phases. Two approaches can be applied to account for this background
erosion and are discussed later. The most realistic approach of the two requires specification of the effective
wave direction. Figure 29.6 presents the downdrift recession rate from 1883 to 1970 due to the cutting in
1892 of St. Lucie Inlet located along the southeast
coast of Florida. The shoreline recession rate immediately downdrift (south) of the inlet was approximately
9 m=year, certainly among the highest in the State of
Florida. With increasing time, the erosion within the
Town of Jupiter Island increased and was addressed
by a large-scale beach nourishment program. To date,
the general area has been nourished with more than
12 million m
3 of sand.
29.3 Role of Structures in Beach Nourishment
Coastal structures can be used to slow or stop erosion of
a specific section of beach by slowing littoral sediment
transport. The main concern regarding coastal structures is that they can have unintended consequences
such that by reducing beach erosion in one area, they
may transfer the erosion to adjacent beaches. This is
illustrated by the example of many groins constructed
prior to understanding the interaction with adjacent
beaches. In recognition of the possible adverse effects
of coastal structures, they are essentially not permittable
in some US coastal states. We regard this stance as unfortunate because, applied carefully, coastal structures
can have a beneficial effect on the entire system. For
example, using structures to reduce erosion of erosional
hot spots (Sect. 29.5.1) within a nourishment project
can reduce sand needs and long term costs. Campbell
et al. [29.3] demonstrated that on an open coastline
structural fields need to extend beyond the hot spot erosion areas to manage down-drift effects.
29.3.1 Terminal Structures
The term terminal structures indicates that the structures are placed at the end of a project or at the end
of a littoral system. Although, as noted, structures are
not considered favorably in many regulatory climates,
terminal structures can provide a substantial benefit to
beach stability. This is especially the case adjacent to
inlets that have been dredged for navigation purposes.
The deepened inlet can act as a sink on both the updrift
and downdrift beaches causing sand to flow into the inlet. Thus, a short structure on the updrift or downdrift