

Beach Nourishment 29.2 Methods of Delivery of Sand for Beach Nourishment 637
Part C | 29.2
cubic meters, large dump trucks delivering approximately 20 m
3 per trip would require 50 000 trips. With
favorable weather conditions, a large dredge can deliver
up to 40 000 m
3 per day resulting in a project duration
of 1–2 months or so allowing for maintenance, weather
down time, etc. The area of the seafloor from which
sand is removed by a dredge is termed a borrow area
and must be investigated thoroughly for sand size suitability and other potential environmental effects.
Dredges usually employed for beach nourishment
include pipeline dredges and hopper dredges. Pipeline
dredges remove the sand from the seafloor with an
intake pipe and convey the sand through a pipeline directly to the nourishment area on the dry beach. The
diameter of the pipeline can vary from 0:5 to 1 m. Hopper dredges operate in more of a batch mode process.
The dredges contain a large storage area in their hull
and have dragarms that trail over the sides of the dredge
through which sand is extracted from the sea floor and
deposited in the hull while the dredge is underway at
a speed of a few knots. In contrast to a pipeline dredge
which operates best while excavating at least a meter cut depth, a hopper dredge skims a relatively thin
layer on the order of 30 cm from the surface of the sea
floor. Hopper dredges are classified by the volumes of
sediment that they hold which can range up to several
thousand cubic meters. Once full, the dredge moves to
the nourishment area where various means are used to
place the sand as beach nourishment. Direct pump out
capacity from the dredge to the beach is becoming more
common although the sand can be dropped to the sea
floor and a pipeline dredge used to transport the sand to
the beach while the hopper dredge returns to the borrow
site for another load.
29.2.1 Characteristics and Considerations
in Design of Beach Nourishment
Projects
Beach nourishment projects are usually constructed
with profiles steeper than equilibrium, in part, to facilitate quantification of sand volumes placed and also
to minimize the immediate introduction of silts and
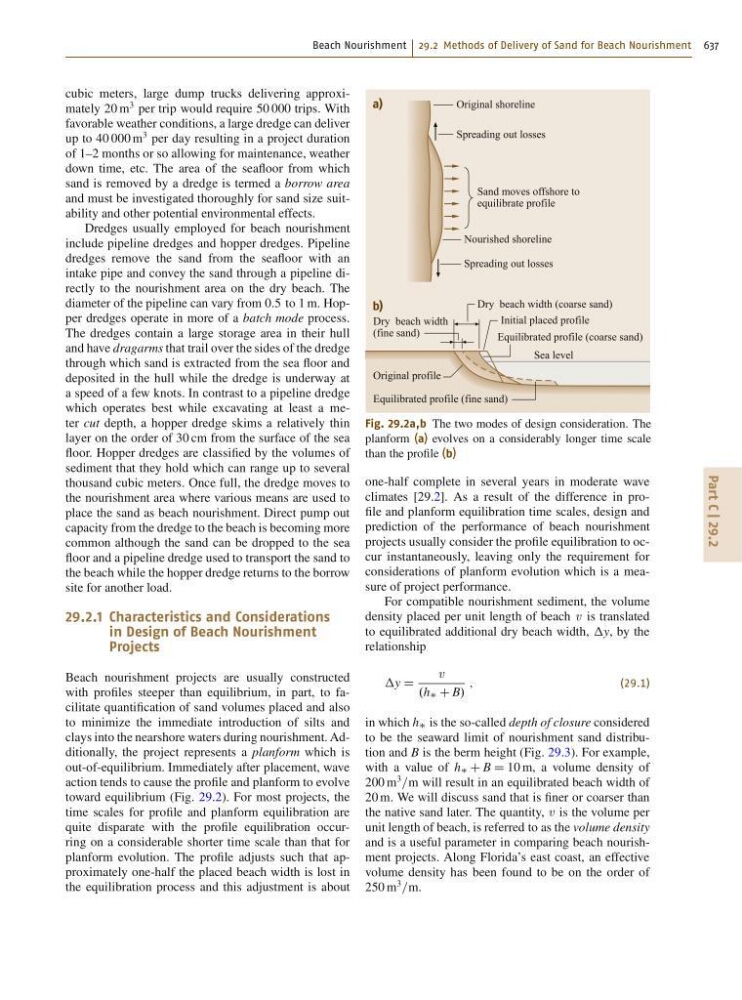
clays into the nearshore waters during nourishment. Additionally, the project represents a planform which is
out-of-equilibrium. Immediately after placement, wave
action tends to cause the profile and planform to evolve
toward equilibrium (Fig. 29.2). For most projects, the
time scales for profile and planform equilibration are
quite disparate with the profile equilibration occurring on a considerable shorter time scale than that for
planform evolution. The profile adjusts such that approximately one-half the placed beach width is lost in
the equilibration process and this adjustment is about
a)
b)
Original shoreline
Spreading out losses
Spreading out losses
Dry beach width (coarse sand)
Initial placed profile
Dry beach width
(fine sand)
Sand moves offshore to
equilibrate profile
Equilibrated profile (coarse sand)
Equilibrated profile (fine sand)
Sea level
Original profile
Nourished shoreline
Fig. 29.2a,b The two modes of design consideration. The
planform (a) evolves on a considerably longer time scale
than the profile (b)
one-half complete in several years in moderate wave
climates [29.2]. As a result of the difference in profile and planform equilibration time scales, design and
prediction of the performance of beach nourishment
projects usually consider the profile equilibration to occur instantaneously, leaving only the requirement for
considerations of planform evolution which is a measure of project performance.
For compatible nourishment sediment, the volume
density placed per unit length of beach v is translated
to equilibrated additional dry beach width, y, by the
relationship
y D
v
.h C B/
;
(29.1)
in which h is the so-called depth of closure considered
to be the seaward limit of nourishment sand distribution and B is the berm height (Fig. 29.3). For example,
with a value of h C B D 10 m, a volume density of
200 m
3
=m will result in an equilibrated beach width of
20 m. We will discuss sand that is finer or coarser than
the native sand later. The quantity, v is the volume per
unit length of beach, is referred to as the volume density
and is a useful parameter in comparing beach nourishment projects. Along Florida’s east coast, an effective
volume density has been found to be on the order of
250 m
3
=m.