

Modeling of Coastal Morphological Processes 28.3 Modeling Approaches 625
Part C | 28.3
presence of longshore current results in enhanced offshore transports in the trough and on the landward bar
slope. Thus, for onshore bar migration also, the incident wave angle and the associated longshore currents
are very important as sand is eroded from the troughs
and deposited on the bar enhancing bar growth and onshore migration.
The implications for the bar response are further illustrated using schematic profiles with bars at
various cross-shore positions, thus varying the water
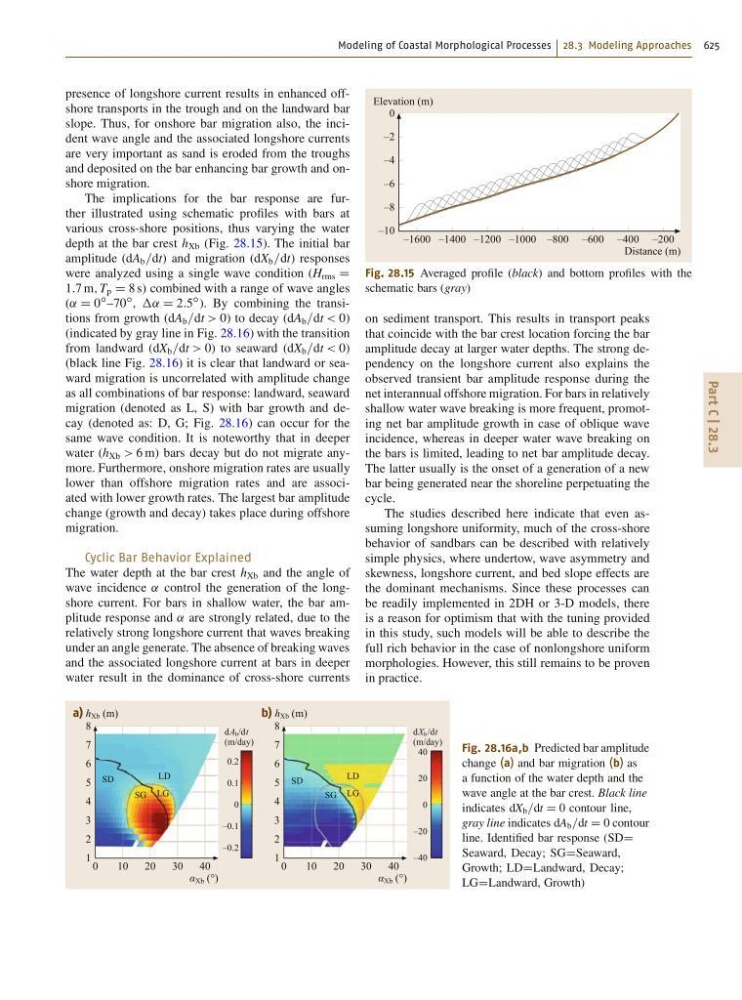
depth at the bar crest h Xb (Fig. 28.15). The initial bar
amplitude (dA b =dt) and migration (dX b =dt) responses
were analyzed using a single wave condition (H rms D
1:7 m; T p D 8 s) combined with a range of wave angles
(˛ D 0
ı –70
ı , ˛ D 2:5
ı ). By combining the transitions from growth (dA b =dt > 0) to decay (dA b =dt < 0)
(indicated by gray line in Fig. 28.16) with the transition
from landward (dX b =dt > 0) to seaward (dX b =dt < 0)
(black line Fig. 28.16) it is clear that landward or seaward migration is uncorrelated with amplitude change
as all combinations of bar response: landward, seaward
migration (denoted as L, S) with bar growth and decay (denoted as: D, G; Fig. 28.16) can occur for the
same wave condition. It is noteworthy that in deeper
water (h Xb > 6 m) bars decay but do not migrate anymore. Furthermore, onshore migration rates are usually
lower than offshore migration rates and are associated with lower growth rates. The largest bar amplitude
change (growth and decay) takes place during offshore
migration.
Cyclic Bar Behavior Explained
The water depth at the bar crest h Xb and the angle of
wave incidence ˛ control the generation of the longshore current. For bars in shallow water, the bar amplitude response and ˛ are strongly related, due to the
relatively strong longshore current that waves breaking
under an angle generate. The absence of breaking waves
and the associated longshore current at bars in deeper
water result in the dominance of cross-shore currents
0
10
20
LD
LD
SG
SG
SD
SD
LG
LG
30
40
a) h Xb (m)
α Xb (°)
8
7
6
5
4
3
2
1
0.2
0.1
0
–0.1
–0.2
dA b /dt
(m/day)
0
10
20
30
40
b) h Xb (m)
α Xb (°)
8
7
6
5
4
3
2
1
40
20
0
–20
–40
dX b /dt
(m/day)
Fig. 28.16a,b Predicted bar amplitude
change (a) and bar migration (b) as
a function of the water depth and the
wave angle at the bar crest. Black line
indicates dX b =dt D 0 contour line,
gray line indicates dA b =dt D 0 contour
line. Identified bar response (SDD
Seaward, Decay; SGDSeaward,
Growth; LDDLandward, Decay;
LGDLandward, Growth)
–1600 –1400 –1200 –1000 –800 –600 –400 –200
Elevation (m)
Distance (m)
0
–2
–4
–6
–8
–10
Fig. 28.15 Averaged profile (black) and bottom profiles with the
schematic bars (gray)
on sediment transport. This results in transport peaks
that coincide with the bar crest location forcing the bar
amplitude decay at larger water depths. The strong dependency on the longshore current also explains the
observed transient bar amplitude response during the
net interannual offshore migration. For bars in relatively
shallow water wave breaking is more frequent, promoting net bar amplitude growth in case of oblique wave
incidence, whereas in deeper water wave breaking on
the bars is limited, leading to net bar amplitude decay.
The latter usually is the onset of a generation of a new
bar being generated near the shoreline perpetuating the
cycle.
The studies described here indicate that even assuming longshore uniformity, much of the cross-shore
behavior of sandbars can be described with relatively
simple physics, where undertow, wave asymmetry and
skewness, longshore current, and bed slope effects are
the dominant mechanisms. Since these processes can
be readily implemented in 2DH or 3-D models, there
is a reason for optimism that with the tuning provided
in this study, such models will be able to describe the
full rich behavior in the case of nonlongshore uniform
morphologies. However, this still remains to be proven
in practice.