

Part C | 28.3
624 Part C Coastal Design
Distance (m)
–1000
–800
–600
–400
–200
H
ms (m)
α (°)
A
B (m)
Perturbation (m)
T
p (s)
a)
b)
c)
d)
e)
4
2
0
50
0
–50
d 1
d 2
d 3
d 4
2
1
0
200
400
600
Time (days)
800
1000
1200
0
1
–1
10
8
6
4
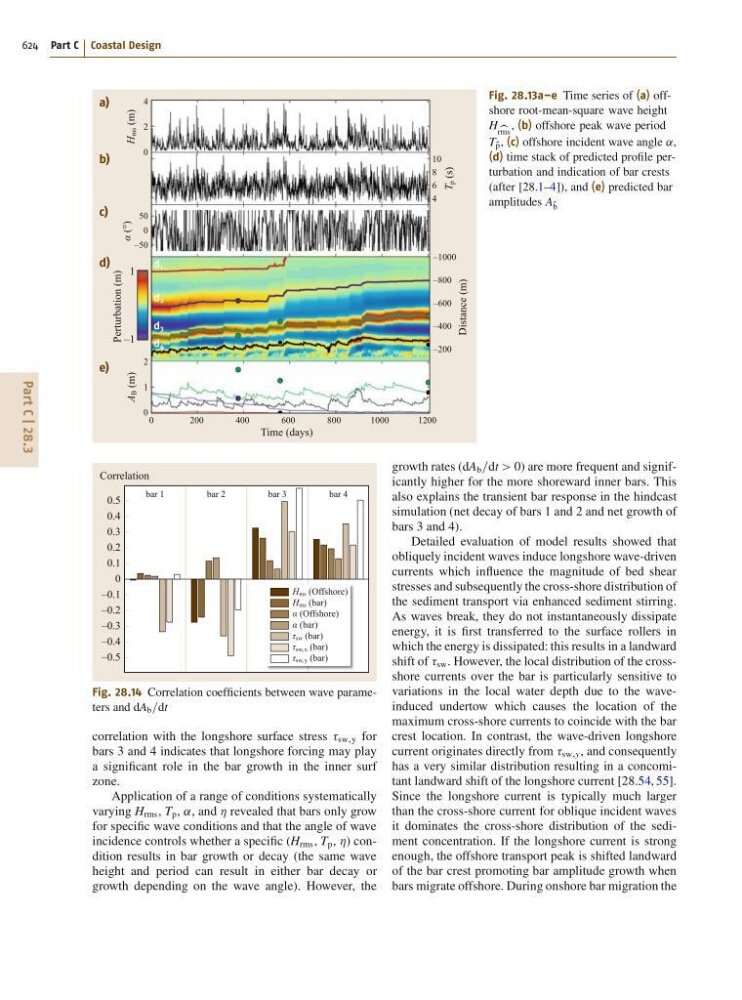
Fig. 28.13a–e Time series of (a) offshore root-mean-square wave height
H b
rms
, (b) offshore peak wave period
T O
p , (c) offshore incident wave angle ˛,
(d) time stack of predicted profile perturbation and indication of bar crests
(after [28.1–4]), and (e) predicted bar
amplitudes A O
b
H ms (Offshore)
H ms (bar)
α (Offshore)
α (bar)
τ sw (bar)
τ sw, x (bar)
τ sw, y (bar)
Correlation
bar 1
bar 2
bar 3
bar 4
0.5
0.4
0.3
0.2
0.1
0
–0.1
–0.2
–0.3
–0.4
–0.5
Fig. 28.14 Correlation coefficients between wave parameters and dA b =dt
correlation with the longshore surface stress sw;y for
bars 3 and 4 indicates that longshore forcing may play
a significant role in the bar growth in the inner surf
zone.
Application of a range of conditions systematically
varying H rms , T p , ˛, and Á revealed that bars only grow
for specific wave conditions and that the angle of wave
incidence controls whether a specific (H rms , T p , Á) condition results in bar growth or decay (the same wave
height and period can result in either bar decay or
growth depending on the wave angle). However, the
growth rates (dA b =dt > 0) are more frequent and significantly higher for the more shoreward inner bars. This
also explains the transient bar response in the hindcast
simulation (net decay of bars 1 and 2 and net growth of
bars 3 and 4).
Detailed evaluation of model results showed that
obliquely incident waves induce longshore wave-driven
currents which influence the magnitude of bed shear
stresses and subsequently the cross-shore distribution of
the sediment transport via enhanced sediment stirring.
As waves break, they do not instantaneously dissipate
energy, it is first transferred to the surface rollers in
which the energy is dissipated: this results in a landward
shift of sw . However, the local distribution of the crossshore currents over the bar is particularly sensitive to
variations in the local water depth due to the waveinduced undertow which causes the location of the
maximum cross-shore currents to coincide with the bar
crest location. In contrast, the wave-driven longshore
current originates directly from sw;y , and consequently
has a very similar distribution resulting in a concomitant landward shift of the longshore current [28.54, 55].
Since the longshore current is typically much larger
than the cross-shore current for oblique incident waves
it dominates the cross-shore distribution of the sediment concentration. If the longshore current is strong
enough, the offshore transport peak is shifted landward
of the bar crest promoting bar amplitude growth when
bars migrate offshore. During onshore bar migration the