

Modeling of Coastal Morphological Processes 28.3 Modeling Approaches 623
Part C | 28.3
modeled physics under a wide range of environmental
conditions. The full results are presented in [28.44].
In the previous section, we have shown that modeling dune erosion and overwash processes do no longer
have to rely on empirical or semiempirical approaches,
but that a process-based approach is feasible. The big
advantage of such an approach is that it is much more
generic and the same model concepts may be applied,
after thorough validation, in widely varying environments, from the sandy North Sea coasts to open-ocean
coral reef environments.
28.3.2 Modeling Cross-Shore Breaker
Bar Cycles
Most sandy coasts have sand-bar features [28.45, 46],
which exhibit a range of behavior, on timescales of
days to decades. Such features are at similar length and
timescales as engineering measures such as groynes,
offshore breakwaters, and nourishments, and their state
at any given time affects the safety of dikes and dunes
behind them. It is therefore very important to unravel the dynamics behind their generation, migration,
and fading out. In a recent paper [28.47], important
steps were taken to do just that; a summary is given
below.
Multiple bar systems often show a cyclic net offshore directed migration with return periods of the order
of years. Typically, a bar is generated near the shoreline,
grows in height and width, while migrating offshore before finally decaying at the seaward limit of the surf
zone [28.48–51]. The observed bar behavior reflects
cross-shore oriented bar variability and is not the result
of alongshore propagating shore oblique bars [28.52].
This implies cross-shore hydrodynamic and sand transport processes are dominant over longshore processes.
Cycle periods vary worldwide between approximately
1 and 15 years [28.49]. The net offshore bar migration
is the result of gradual onshore movement during calm
periods and episodic strong offshore movement during
storms. However, the longshore coherence does not imply that bars along the coast are in the same phase of
the cycle. At certain locations, distinct shifts can be observed in which for example the outer is attached to an
inner bar, this is often referred to as bar switching. Furthermore, small alongshore variations in bar position
and crest height may result in a different morphological response during parts of the cycle period.
Walstra and Ruessink [28.53] explored the suitability of a process-based cross-shore profile model
(Unibest-TC, [28.17]) to hindcast one cycle at Noordwijk, the Netherlands from 1984 to 1987 using the
standardized calibration approach of [28.17]. The multiple bar system at Noordwijk in the Netherlands was
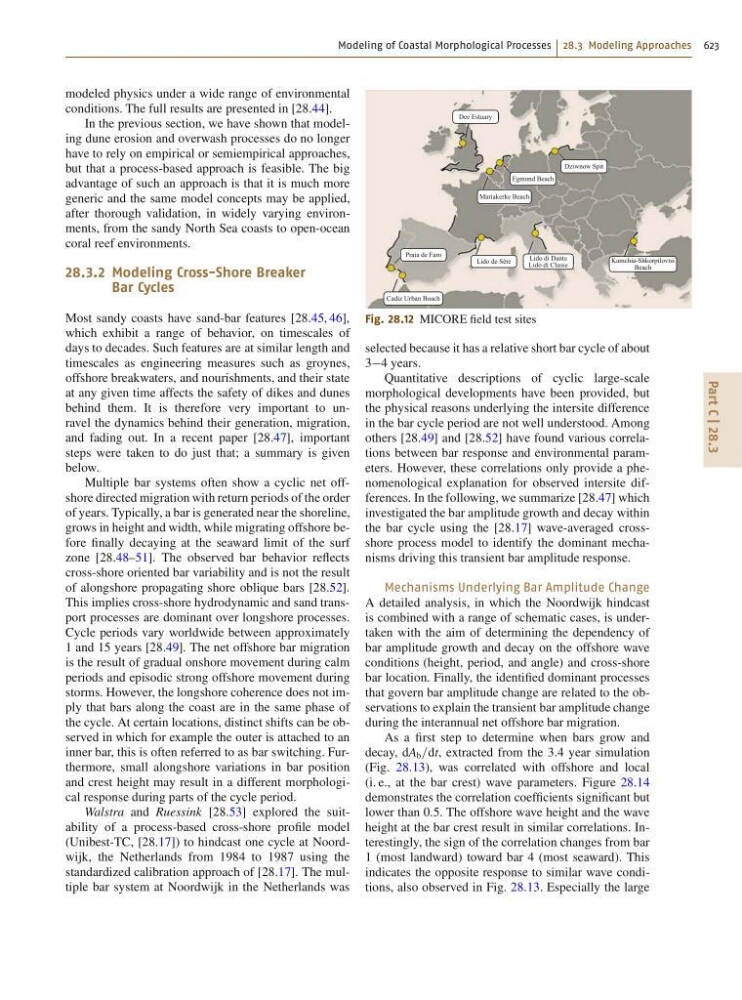
Cadiz Urban Boach
Praia de Faro
Lido de Sète
Mariakerke Beach
Egmond Beach
Dee Estuary
Dziwnow Spit
Lido di Dante
Lido di Classe
Kamchia-Shkorpilovtsi
Beach
Fig. 28.12 MICORE field test sites
selected because it has a relative short bar cycle of about
34 years.
Quantitative descriptions of cyclic large-scale
morphological developments have been provided, but
the physical reasons underlying the intersite difference
in the bar cycle period are not well understood. Among
others [28.49] and [28.52] have found various correlations between bar response and environmental parameters. However, these correlations only provide a phenomenological explanation for observed intersite differences. In the following, we summarize [28.47] which
investigated the bar amplitude growth and decay within
the bar cycle using the [28.17] wave-averaged crossshore process model to identify the dominant mechanisms driving this transient bar amplitude response.
Mechanisms Underlying Bar Amplitude Change
A detailed analysis, in which the Noordwijk hindcast
is combined with a range of schematic cases, is undertaken with the aim of determining the dependency of
bar amplitude growth and decay on the offshore wave
conditions (height, period, and angle) and cross-shore
bar location. Finally, the identified dominant processes
that govern bar amplitude change are related to the observations to explain the transient bar amplitude change
during the interannual net offshore bar migration.
As a first step to determine when bars grow and
decay, dA b =dt, extracted from the 3.4 year simulation
(Fig. 28.13), was correlated with offshore and local
(i. e., at the bar crest) wave parameters. Figure 28.14
demonstrates the correlation coefficients significant but
lower than 0.5. The offshore wave height and the wave
height at the bar crest result in similar correlations. Interestingly, the sign of the correlation changes from bar
1 (most landward) toward bar 4 (most seaward). This
indicates the opposite response to similar wave conditions, also observed in Fig. 28.13. Especially the large