

Part C | 28.3
622 Part C Coastal Design
5.5
5.6
5.7
5.8
Erosion-deposition measured (m)
5.9
6
c) y (× 10
5 m)
a)
x (× 10
4 m)
4.44
4.435
4.43
4.425
4.42
4.415
4.41
4.405
5.5
5.6
5.7
5.8
Erosion-deposition XBeach (m)
5.9
6
8
6
4
2
0
–2
–4
–6
–8
6
4
2
0
–2
–4
–6
d) y (× 10
5 m)
x (× 10
4 m)
5.6 5.65 5.7 5.75 5.8
x (× 10
4 m)
4.44
4.435
4.43
4.425
4.42
4.415
4.41
4.405
b) y (× 10
5 m)
4.44
4.435
4.43
4.425
4.42
4.415
4.41
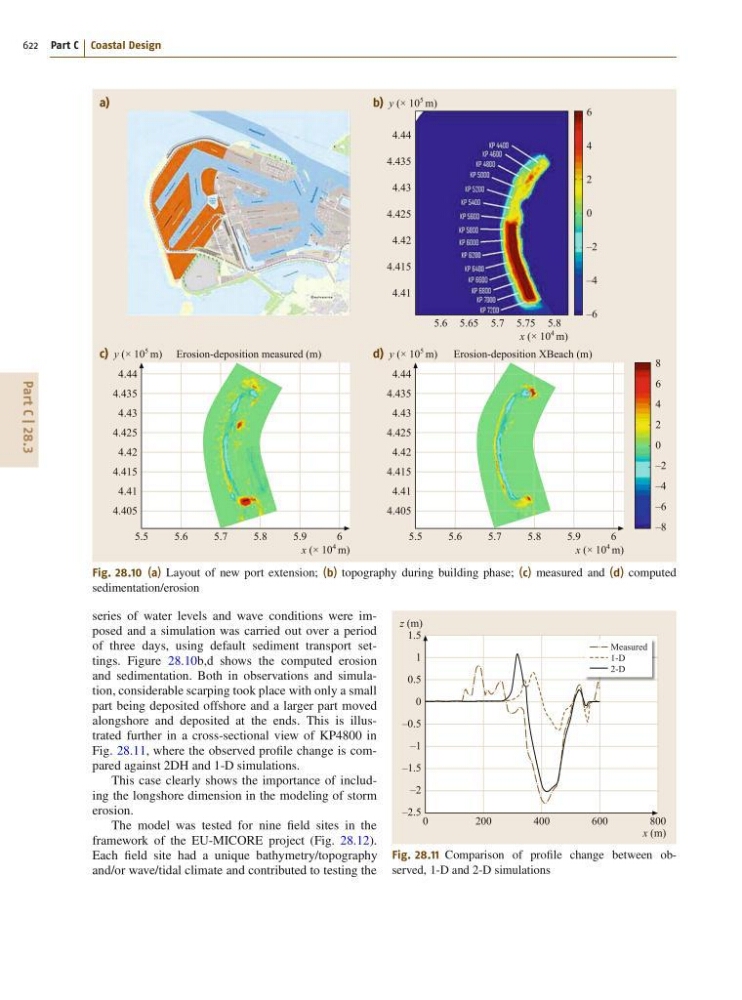
Fig. 28.10 (a) Layout of new port extension; (b) topography during building phase; (c) measured and (d) computed
sedimentation/erosion
series of water levels and wave conditions were imposed and a simulation was carried out over a period
of three days, using default sediment transport settings. Figure 28.10b,d shows the computed erosion
and sedimentation. Both in observations and simulation, considerable scarping took place with only a small
part being deposited offshore and a larger part moved
alongshore and deposited at the ends. This is illustrated further in a cross-sectional view of KP4800 in
Fig. 28.11, where the observed profile change is compared against 2DH and 1-D simulations.
This case clearly shows the importance of including the longshore dimension in the modeling of storm
erosion.
The model was tested for nine field sites in the
framework of the EU-MICORE project (Fig. 28.12).
Each field site had a unique bathymetry/topography
and/or wave/tidal climate and contributed to testing the
Measured
1-D
2-D
0
200
400
600
800
z (m)
x (m)
1.5
1
0.5
0
–0.5
–1
–1.5
–2
–2.5
Fig. 28.11 Comparison of profile change between observed, 1-D and 2-D simulations