

Modeling of Coastal Morphological Processes 28.3 Modeling Approaches 621
Part C | 28.3
long-wave motions and the avalanching mechanism is
illustrated.
In [28.40], extensive validation is shown for hydrodynamics, sediment transport, and profile evolution for
a number of test cases. This number has since been extended to practically all large-scale tests used in the past
to develop empirical dune erosion models, and results
can be found in the regularly updated skillbed report on
www.xbeach.org.
2DH Validation Tests
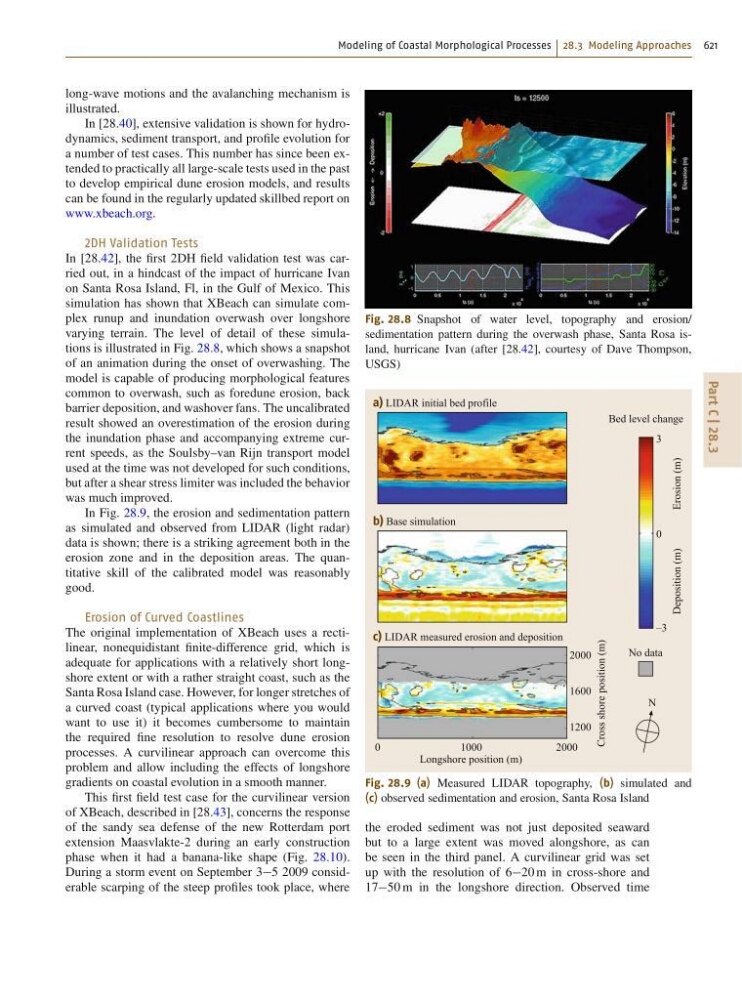
In [28.42], the first 2DH field validation test was carried out, in a hindcast of the impact of hurricane Ivan
on Santa Rosa Island, Fl, in the Gulf of Mexico. This
simulation has shown that XBeach can simulate complex runup and inundation overwash over longshore
varying terrain. The level of detail of these simulations is illustrated in Fig. 28.8, which shows a snapshot
of an animation during the onset of overwashing. The
model is capable of producing morphological features
common to overwash, such as foredune erosion, back
barrier deposition, and washover fans. The uncalibrated
result showed an overestimation of the erosion during
the inundation phase and accompanying extreme current speeds, as the Soulsby–van Rijn transport model
used at the time was not developed for such conditions,
but after a shear stress limiter was included the behavior
was much improved.
In Fig. 28.9, the erosion and sedimentation pattern
as simulated and observed from LIDAR (light radar)
data is shown; there is a striking agreement both in the
erosion zone and in the deposition areas. The quantitative skill of the calibrated model was reasonably
good.
Erosion of Curved Coastlines
The original implementation of XBeach uses a rectilinear, nonequidistant finite-difference grid, which is
adequate for applications with a relatively short longshore extent or with a rather straight coast, such as the
Santa Rosa Island case. However, for longer stretches of
a curved coast (typical applications where you would
want to use it) it becomes cumbersome to maintain
the required fine resolution to resolve dune erosion
processes. A curvilinear approach can overcome this
problem and allow including the effects of longshore
gradients on coastal evolution in a smooth manner.
This first field test case for the curvilinear version
of XBeach, described in [28.43], concerns the response
of the sandy sea defense of the new Rotterdam port
extension Maasvlakte-2 during an early construction
phase when it had a banana-like shape (Fig. 28.10).
During a storm event on September 35 2009 considerable scarping of the steep profiles took place, where
Fig. 28.8 Snapshot of water level, topography and erosion/
sedimentation pattern during the overwash phase, Santa Rosa island, hurricane Ivan (after [28.42], courtesy of Dave Thompson,
USGS)
0
1000
Longshore position (m)
2000
a) LIDAR initial bed profile
b) Base simulation
c) LIDAR measured erosion and deposition
3
Bed level change
No data
Deposition (m)
Cross shore position (m)
Erosion (m)
N
0
2000
1600
1200
–3
Fig. 28.9 (a) Measured LIDAR topography, (b) simulated and
(c) observed sedimentation and erosion, Santa Rosa Island
the eroded sediment was not just deposited seaward
but to a large extent was moved alongshore, as can
be seen in the third panel. A curvilinear grid was set
up with the resolution of 620 m in cross-shore and
1750 m in the longshore direction. Observed time