

Part A | 2.5
32 Part A Fundamentals
Table 2.5 Characteristics of the most intense hurricanes that made landfall in the US between 1900 and 1996 in terms
of their categorization and central air pressure (after [2.10])
Pressure a
Hurricane
Year
Category
[mb]
[in Hg]
[mm Hg]
Gilbert
1988
5
888
26.2
666.1
Florida Keys
1935
5
892
26.35
669.2
Camille
1969
5
909
26.84
681.7
Andrew
1992
4
922
27.23
691.6
Florida Keys/S. Texas
1919
4
927
27.37
695.2
Lake Okeechobee, Fl.
1928
4
929
27.43
696.7
Donna
1960
4
930
27.46
697.5
Galveston, TX
1900
4
931
27.49
698.2
Grand Isle, LA
1909
4
931
27.49
698.2
New Orleans, LA
1915
4
931
27.49
698.2
Carla
1961
4
931
27.49
698.2
Hugo
1989
4
934
27.58
700.5
Miami, FL/Pensacola, FL
1926
4
935
27.61
701.3
Hazel
1954
4 b
938
27.70
703.6
SE FL/SE MS/AL
1947
4
940
27.76
705.1
North Texas
1932
4
941
27.79
705.9
Opal
1995
3
b
942
27.82
706.6
Frederic
1979
3
946
27.94
709.7
Betsy
1965
3
948
27.99
710.9
Fran
1996
3
954
28.17
714.8
a Pressure exerted by the atmosphere at sea level is equal to 1 atmosphere, which is equal to 760 mm of mercury (760 mmHg),
1:01325 bar, 1013:25 mar, 29.92 inches of mercury (29:92 in Hg), and 14.7 pounds per square inch (14:7 psi)
b Hurricanses traveling more than 50 km=h.
S
P
O
Nova Scotia
Bay of
Fundy
Long Is.
N
2
1
0
–1
L
K
(m)
I
H
G
F
E
D
C
B
A
M
Aug 27 28
0
1000 km
0730 Time of day
1930
29
30
Hurrican Carol, 1954
31
Sept 1
2
R
Q
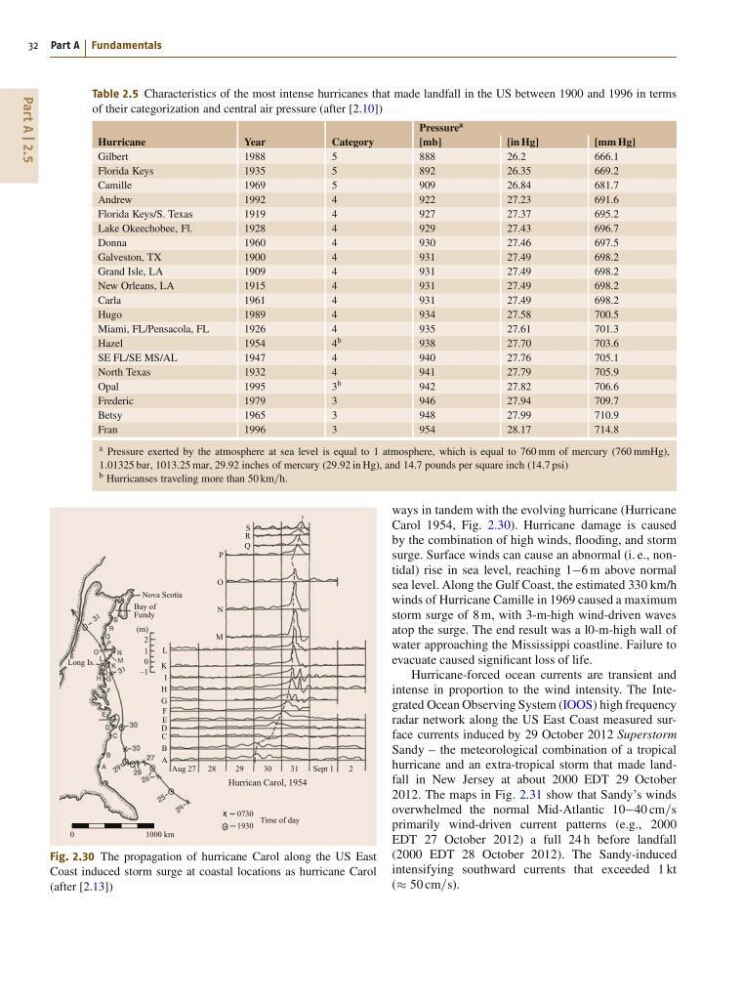
Fig. 2.30 The propagation of hurricane Carol along the US East
Coast induced storm surge at coastal locations as hurricane Carol
(after [2.13])
ways in tandem with the evolving hurricane (Hurricane
Carol 1954, Fig. 2.30). Hurricane damage is caused
by the combination of high winds, flooding, and storm
surge. Surface winds can cause an abnormal (i. e., nontidal) rise in sea level, reaching 16 m above normal
sea level. Along the Gulf Coast, the estimated 330 km/h
winds of Hurricane Camille in 1969 caused a maximum
storm surge of 8 m, with 3-m-high wind-driven waves
atop the surge. The end result was a l0-m-high wall of
water approaching the Mississippi coastline. Failure to
evacuate caused significant loss of life.
Hurricane-forced ocean currents are transient and
intense in proportion to the wind intensity. The Integrated Ocean Observing System (IOOS) high frequency
radar network along the US East Coast measured surface currents induced by 29 October 2012 Superstorm
Sandy – the meteorological combination of a tropical
hurricane and an extra-tropical storm that made landfall in New Jersey at about 2000 EDT 29 October
2012. The maps in Fig. 2.31 show that Sandy’s winds
overwhelmed the normal Mid-Atlantic 1040 cm=s
primarily wind-driven current patterns (e.g., 2000
EDT 27 October 2012) a full 24 h before landfall
(2000 EDT 28 October 2012). The Sandy-induced
intensifying southward currents that exceeded 1 kt
( 50 cm=s).
32 Part A Fundamentals
Table 2.5 Characteristics of the most intense hurricanes that made landfall in the US between 1900 and 1996 in terms
of their categorization and central air pressure (after [2.10])
Pressure a
Hurricane
Year
Category
[mb]
[in Hg]
[mm Hg]
Gilbert
1988
5
888
26.2
666.1
Florida Keys
1935
5
892
26.35
669.2
Camille
1969
5
909
26.84
681.7
Andrew
1992
4
922
27.23
691.6
Florida Keys/S. Texas
1919
4
927
27.37
695.2
Lake Okeechobee, Fl.
1928
4
929
27.43
696.7
Donna
1960
4
930
27.46
697.5
Galveston, TX
1900
4
931
27.49
698.2
Grand Isle, LA
1909
4
931
27.49
698.2
New Orleans, LA
1915
4
931
27.49
698.2
Carla
1961
4
931
27.49
698.2
Hugo
1989
4
934
27.58
700.5
Miami, FL/Pensacola, FL
1926
4
935
27.61
701.3
Hazel
1954
4 b
938
27.70
703.6
SE FL/SE MS/AL
1947
4
940
27.76
705.1
North Texas
1932
4
941
27.79
705.9
Opal
1995
3
b
942
27.82
706.6
Frederic
1979
3
946
27.94
709.7
Betsy
1965
3
948
27.99
710.9
Fran
1996
3
954
28.17
714.8
a Pressure exerted by the atmosphere at sea level is equal to 1 atmosphere, which is equal to 760 mm of mercury (760 mmHg),
1:01325 bar, 1013:25 mar, 29.92 inches of mercury (29:92 in Hg), and 14.7 pounds per square inch (14:7 psi)
b Hurricanses traveling more than 50 km=h.
S
P
O
Nova Scotia
Bay of
Fundy
Long Is.
N
2
1
0
–1
L
K
(m)
I
H
G
F
E
D
C
B
A
M
Aug 27 28
0
1000 km
0730 Time of day
1930
29
30
Hurrican Carol, 1954
31
Sept 1
2
R
Q
Fig. 2.30 The propagation of hurricane Carol along the US East
Coast induced storm surge at coastal locations as hurricane Carol
(after [2.13])
ways in tandem with the evolving hurricane (Hurricane
Carol 1954, Fig. 2.30). Hurricane damage is caused
by the combination of high winds, flooding, and storm
surge. Surface winds can cause an abnormal (i. e., nontidal) rise in sea level, reaching 16 m above normal
sea level. Along the Gulf Coast, the estimated 330 km/h
winds of Hurricane Camille in 1969 caused a maximum
storm surge of 8 m, with 3-m-high wind-driven waves
atop the surge. The end result was a l0-m-high wall of
water approaching the Mississippi coastline. Failure to
evacuate caused significant loss of life.
Hurricane-forced ocean currents are transient and
intense in proportion to the wind intensity. The Integrated Ocean Observing System (IOOS) high frequency
radar network along the US East Coast measured surface currents induced by 29 October 2012 Superstorm
Sandy – the meteorological combination of a tropical
hurricane and an extra-tropical storm that made landfall in New Jersey at about 2000 EDT 29 October
2012. The maps in Fig. 2.31 show that Sandy’s winds
overwhelmed the normal Mid-Atlantic 1040 cm=s
primarily wind-driven current patterns (e.g., 2000
EDT 27 October 2012) a full 24 h before landfall
(2000 EDT 28 October 2012). The Sandy-induced
intensifying southward currents that exceeded 1 kt
( 50 cm=s).