

Part B | 21.1
488 Part B Autonomous Ocean Vehicles, Subsystems and Control
Y
Z
X
74°W
72°W
70°W
a)
42°N
41°N
40°N
39°N
38°N
37°N
26.9
26.3
25.6
25.0
24.4
23.8
23.1
22.5
21.9
21.3
20.6
20.0
19.4
18.8
18.1
17.5
16.9
16.3
15.6
b)
26.9
26.3
25.6
25.0
24.4
23.8
23.1
22.5
21.9
21.3
20.6
20.0
19.4
18.8
18.1
17.5
16.9
16.3
15.6
74°W
73°W
72°W 71°30′W
72°30′W
73°30′W
c)
e)
40°N
39°30′N
39°N
38°30′N
38°N
84
78
72
66
60
54
48
42
36
30
24
18
12
6
74°W
73°W
72°W 71°30′W
72°30′W
73°30′W
74°W
73°W
72°W 71°30′W
72°30′W
73°30′W
40°N
39°30′N
39°N
38°30′N
38°N
40°N
39°30′N
39°N
38°30′N
38°N
47
43
40
37
33
30
27
23
20
17
13
10
7
3
d)
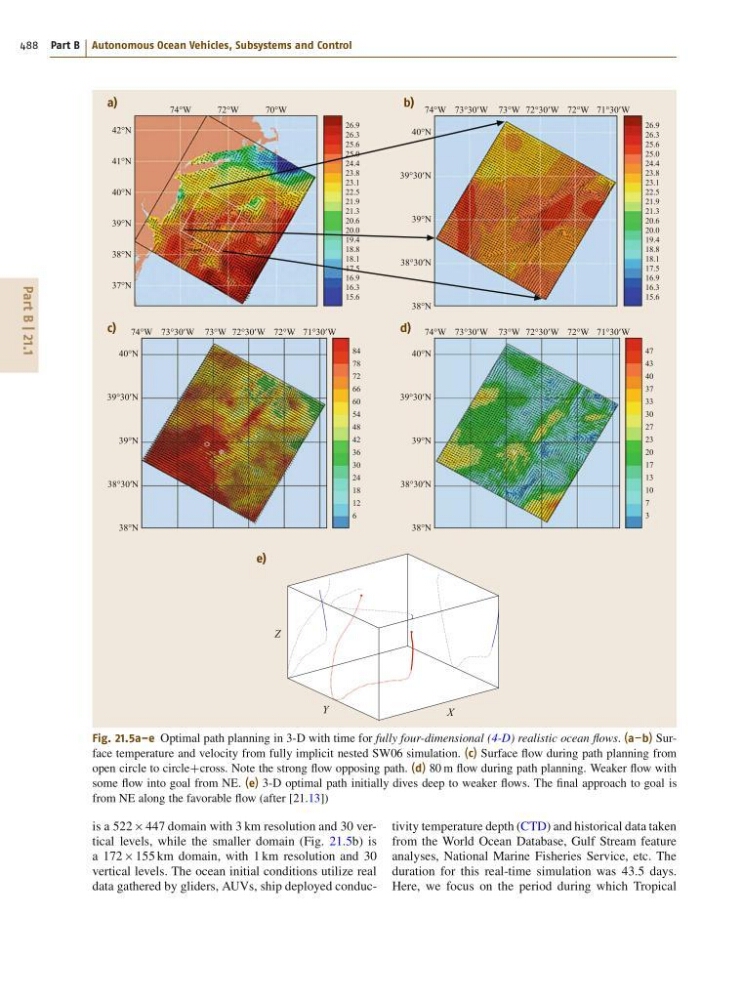
Fig. 21.5a–e Optimal path planning in 3-D with time for fully four-dimensional (4-D) realistic ocean flows. (a–b) Surface temperature and velocity from fully implicit nested SW06 simulation. (c) Surface flow during path planning from
open circle to circleCcross. Note the strong flow opposing path. (d) 80 m flow during path planning. Weaker flow with
some flow into goal from NE. (e) 3-D optimal path initially dives deep to weaker flows. The final approach to goal is
from NE along the favorable flow (after [21.13])
is a 522 447 domain with 3 km resolution and 30 vertical levels, while the smaller domain (Fig. 21.5b) is
a 172 155 km domain, with 1 km resolution and 30
vertical levels. The ocean initial conditions utilize real
data gathered by gliders, AUVs, ship deployed conductivity temperature depth (CTD) and historical data taken
from the World Ocean Database, Gulf Stream feature
analyses, National Marine Fisheries Service, etc. The
duration for this real-time simulation was 43:5 days.
Here, we focus on the period during which Tropical
488 Part B Autonomous Ocean Vehicles, Subsystems and Control
Y
Z
X
74°W
72°W
70°W
a)
42°N
41°N
40°N
39°N
38°N
37°N
26.9
26.3
25.6
25.0
24.4
23.8
23.1
22.5
21.9
21.3
20.6
20.0
19.4
18.8
18.1
17.5
16.9
16.3
15.6
b)
26.9
26.3
25.6
25.0
24.4
23.8
23.1
22.5
21.9
21.3
20.6
20.0
19.4
18.8
18.1
17.5
16.9
16.3
15.6
74°W
73°W
72°W 71°30′W
72°30′W
73°30′W
c)
e)
40°N
39°30′N
39°N
38°30′N
38°N
84
78
72
66
60
54
48
42
36
30
24
18
12
6
74°W
73°W
72°W 71°30′W
72°30′W
73°30′W
74°W
73°W
72°W 71°30′W
72°30′W
73°30′W
40°N
39°30′N
39°N
38°30′N
38°N
40°N
39°30′N
39°N
38°30′N
38°N
47
43
40
37
33
30
27
23
20
17
13
10
7
3
d)
Fig. 21.5a–e Optimal path planning in 3-D with time for fully four-dimensional (4-D) realistic ocean flows. (a–b) Surface temperature and velocity from fully implicit nested SW06 simulation. (c) Surface flow during path planning from
open circle to circleCcross. Note the strong flow opposing path. (d) 80 m flow during path planning. Weaker flow with
some flow into goal from NE. (e) 3-D optimal path initially dives deep to weaker flows. The final approach to goal is
from NE along the favorable flow (after [21.13])
is a 522 447 domain with 3 km resolution and 30 vertical levels, while the smaller domain (Fig. 21.5b) is
a 172 155 km domain, with 1 km resolution and 30
vertical levels. The ocean initial conditions utilize real
data gathered by gliders, AUVs, ship deployed conductivity temperature depth (CTD) and historical data taken
from the World Ocean Database, Gulf Stream feature
analyses, National Marine Fisheries Service, etc. The
duration for this real-time simulation was 43:5 days.
Here, we focus on the period during which Tropical