

Acoustic Communication 15.4 Propagation Channel 373
Part B | 15.4
1
2
3
4
2
3
1
4
–5
–3
–2
–1
0
1
2
3
4
5
6
7
0
5
1 0
Impulse response magnitude
b) Multipath intensity profile
a) Time (s)
Delay (ms)
Delay (ms)
1
0.8
0.6
0.4
0.2
0
0
5
10 15 20 25 30 35 40 45
50
50
c) Tap intensity
Delay (ms)
2.5
2
1.5
1
0.5
0
0
1
2
3
d) 2000
1500
1000
500
0
1
3
2
4
0
1
2
3
2000
1500
1000
500
0
0
1
2
3
2000
1500
1000
500
0
0
1
2
3
2000
1500
1000
500
0
0
10
20
30
40
50
0.9
0.8
0.7
0.6
0.5
0.4
0.3
0.2
0.1
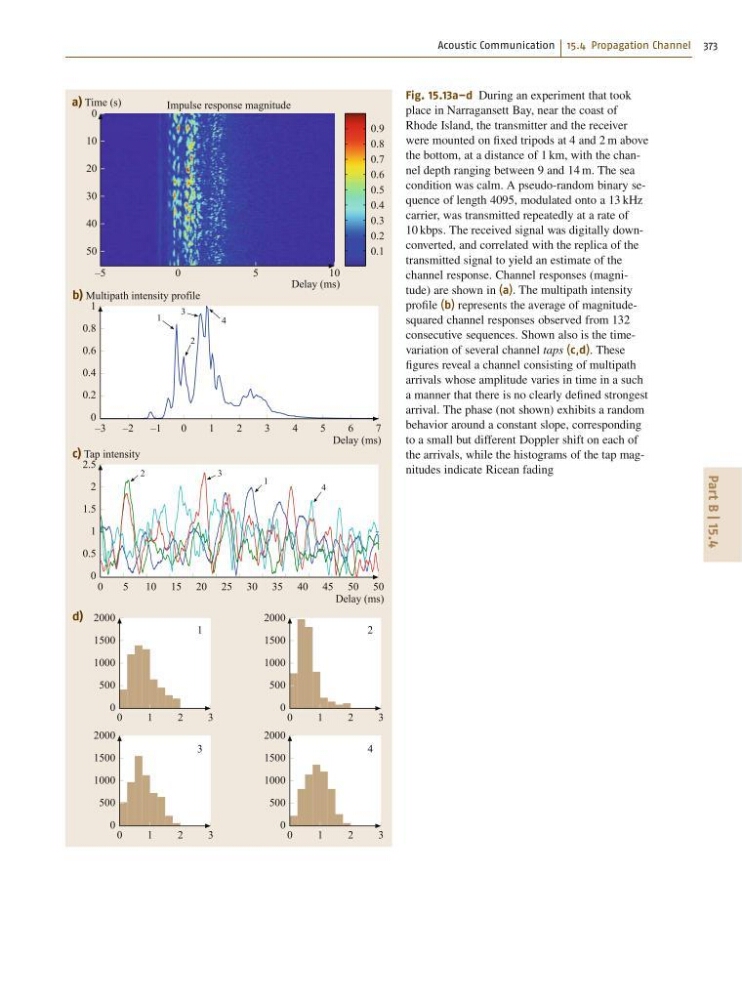
Fig. 15.13a–d During an experiment that took
place in Narragansett Bay, near the coast of
Rhode Island, the transmitter and the receiver
were mounted on fixed tripods at 4 and 2 m above
the bottom, at a distance of 1 km, with the channel depth ranging between 9 and 14 m. The sea
condition was calm. A pseudo-random binary sequence of length 4095, modulated onto a 13 kHz
carrier, was transmitted repeatedly at a rate of
10 kbps. The received signal was digitally downconverted, and correlated with the replica of the
transmitted signal to yield an estimate of the
channel response. Channel responses (magnitude) are shown in (a). The multipath intensity
profile (b) represents the average of magnitudesquared channel responses observed from 132
consecutive sequences. Shown also is the timevariation of several channel taps (c,d). These
figures reveal a channel consisting of multipath
arrivals whose amplitude varies in time in a such
a manner that there is no clearly defined strongest
arrival. The phase (not shown) exhibits a random
behavior around a constant slope, corresponding
to a small but different Doppler shift on each of
the arrivals, while the histograms of the tap magnitudes indicate Ricean fading
Part B | 15.4
1
2
3
4
2
3
1
4
–5
–3
–2
–1
0
1
2
3
4
5
6
7
0
5
1 0
Impulse response magnitude
b) Multipath intensity profile
a) Time (s)
Delay (ms)
Delay (ms)
1
0.8
0.6
0.4
0.2
0
0
5
10 15 20 25 30 35 40 45
50
50
c) Tap intensity
Delay (ms)
2.5
2
1.5
1
0.5
0
0
1
2
3
d) 2000
1500
1000
500
0
1
3
2
4
0
1
2
3
2000
1500
1000
500
0
0
1
2
3
2000
1500
1000
500
0
0
1
2
3
2000
1500
1000
500
0
0
10
20
30
40
50
0.9
0.8
0.7
0.6
0.5
0.4
0.3
0.2
0.1
Fig. 15.13a–d During an experiment that took
place in Narragansett Bay, near the coast of
Rhode Island, the transmitter and the receiver
were mounted on fixed tripods at 4 and 2 m above
the bottom, at a distance of 1 km, with the channel depth ranging between 9 and 14 m. The sea
condition was calm. A pseudo-random binary sequence of length 4095, modulated onto a 13 kHz
carrier, was transmitted repeatedly at a rate of
10 kbps. The received signal was digitally downconverted, and correlated with the replica of the
transmitted signal to yield an estimate of the
channel response. Channel responses (magnitude) are shown in (a). The multipath intensity
profile (b) represents the average of magnitudesquared channel responses observed from 132
consecutive sequences. Shown also is the timevariation of several channel taps (c,d). These
figures reveal a channel consisting of multipath
arrivals whose amplitude varies in time in a such
a manner that there is no clearly defined strongest
arrival. The phase (not shown) exhibits a random
behavior around a constant slope, corresponding
to a small but different Doppler shift on each of
the arrivals, while the histograms of the tap magnitudes indicate Ricean fading