

Part B | 12.4
314 Part B Autonomous Ocean Vehicles, Subsystems and Control
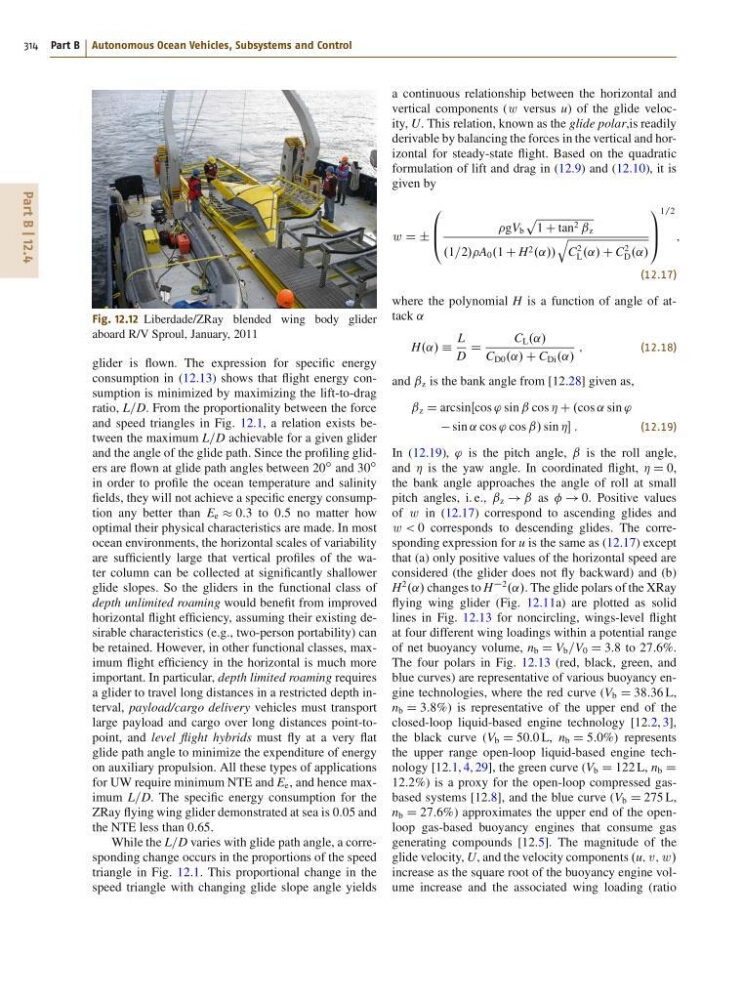
Fig. 12.12 Liberdade/ZRay blended wing body glider
aboard R/V Sproul, January, 2011
glider is flown. The expression for specific energy
consumption in (12.13) shows that flight energy consumption is minimized by maximizing the lift-to-drag
ratio, L=D. From the proportionality between the force
and speed triangles in Fig. 12.1, a relation exists between the maximum L=D achievable for a given glider
and the angle of the glide path. Since the profiling gliders are flown at glide path angles between 20
ı and 30
ı
in order to profile the ocean temperature and salinity
fields, they will not achieve a specific energy consumption any better than E e 0:3 to 0:5 no matter how
optimal their physical characteristics are made. In most
ocean environments, the horizontal scales of variability
are sufficiently large that vertical profiles of the water column can be collected at significantly shallower
glide slopes. So the gliders in the functional class of
depth unlimited roaming would benefit from improved
horizontal flight efficiency, assuming their existing desirable characteristics (e.g., two-person portability) can
be retained. However, in other functional classes, maximum flight efficiency in the horizontal is much more
important. In particular, depth limited roaming requires
a glider to travel long distances in a restricted depth interval, payload/cargo delivery vehicles must transport
large payload and cargo over long distances point-topoint, and level flight hybrids must fly at a very flat
glide path angle to minimize the expenditure of energy
on auxiliary propulsion. All these types of applications
for UW require minimum NTE and E e , and hence maximum L=D. The specific energy consumption for the
ZRay flying wing glider demonstrated at sea is 0:05 and
the NTE less than 0:65.
While the L=D varies with glide path angle, a corresponding change occurs in the proportions of the speed
triangle in Fig. 12.1. This proportional change in the
speed triangle with changing glide slope angle yields
a continuous relationship between the horizontal and
vertical components (w versus u) of the glide velocity, U. This relation, known as the glide polar,is readily
derivable by balancing the forces in the vertical and horizontal for steady-state flight. Based on the quadratic
formulation of lift and drag in (12.9) and (12.10), it is
given by
w D ˙
0
B
@
gV b
p
1 C tan 2 ˇ z
.1=2//A 0 .1 C H 2 .˛//
q
C
2
L .˛/ C C
2
D .˛/
1
C
A
1=2
;
(12.17)
where the polynomial H is a function of angle of attack ˛
H.˛/ Á
L
D
D
C L .˛/
C D0 .˛/ C C Di .˛/
;
(12.18)
and ˇ z is the bank angle from [12.28] given as,
ˇ z D arcsinŒcos ' sin ˇ cos Á C .cos ˛ sin '
sin ˛ cos ' cos ˇ/ sin Á :
(12.19)
In (12.19), ' is the pitch angle, ˇ is the roll angle,
and Á is the yaw angle. In coordinated flight, Á D 0,
the bank angle approaches the angle of roll at small
pitch angles, i. e., ˇ z ! ˇ as ! 0. Positive values
of w in (12.17) correspond to ascending glides and
w < 0 corresponds to descending glides. The corresponding expression for u is the same as (12.17) except
that (a) only positive values of the horizontal speed are
considered (the glider does not fly backward) and (b)
H
2
.˛/ changes to H
2
.˛/. The glide polars of the XRay
flying wing glider (Fig. 12.11a) are plotted as solid
lines in Fig. 12.13 for noncircling, wings-level flight
at four different wing loadings within a potential range
of net buoyancy volume, n b D V b =V 0 D 3:8 to 27:6%.
The four polars in Fig. 12.13 (red, black, green, and
blue curves) are representative of various buoyancy engine technologies, where the red curve (V b D 38:36 L,
n b D 3:8%) is representative of the upper end of the
closed-loop liquid-based engine technology [12.2, 3],
the black curve (V b D 50:0 L, n b D 5:0%) represents
the upper range open-loop liquid-based engine technology [12.1, 4, 29], the green curve (V b D 122 L, n b D
12:2%) is a proxy for the open-loop compressed gasbased systems [12.8], and the blue curve (V b D 275 L,
n b D 27:6%) approximates the upper end of the openloop gas-based buoyancy engines that consume gas
generating compounds [12.5]. The magnitude of the
glide velocity, U, and the velocity components .u; v ; w /
increase as the square root of the buoyancy engine volume increase and the associated wing loading (ratio
314 Part B Autonomous Ocean Vehicles, Subsystems and Control
Fig. 12.12 Liberdade/ZRay blended wing body glider
aboard R/V Sproul, January, 2011
glider is flown. The expression for specific energy
consumption in (12.13) shows that flight energy consumption is minimized by maximizing the lift-to-drag
ratio, L=D. From the proportionality between the force
and speed triangles in Fig. 12.1, a relation exists between the maximum L=D achievable for a given glider
and the angle of the glide path. Since the profiling gliders are flown at glide path angles between 20
ı and 30
ı
in order to profile the ocean temperature and salinity
fields, they will not achieve a specific energy consumption any better than E e 0:3 to 0:5 no matter how
optimal their physical characteristics are made. In most
ocean environments, the horizontal scales of variability
are sufficiently large that vertical profiles of the water column can be collected at significantly shallower
glide slopes. So the gliders in the functional class of
depth unlimited roaming would benefit from improved
horizontal flight efficiency, assuming their existing desirable characteristics (e.g., two-person portability) can
be retained. However, in other functional classes, maximum flight efficiency in the horizontal is much more
important. In particular, depth limited roaming requires
a glider to travel long distances in a restricted depth interval, payload/cargo delivery vehicles must transport
large payload and cargo over long distances point-topoint, and level flight hybrids must fly at a very flat
glide path angle to minimize the expenditure of energy
on auxiliary propulsion. All these types of applications
for UW require minimum NTE and E e , and hence maximum L=D. The specific energy consumption for the
ZRay flying wing glider demonstrated at sea is 0:05 and
the NTE less than 0:65.
While the L=D varies with glide path angle, a corresponding change occurs in the proportions of the speed
triangle in Fig. 12.1. This proportional change in the
speed triangle with changing glide slope angle yields
a continuous relationship between the horizontal and
vertical components (w versus u) of the glide velocity, U. This relation, known as the glide polar,is readily
derivable by balancing the forces in the vertical and horizontal for steady-state flight. Based on the quadratic
formulation of lift and drag in (12.9) and (12.10), it is
given by
w D ˙
0
B
@
gV b
p
1 C tan 2 ˇ z
.1=2//A 0 .1 C H 2 .˛//
q
C
2
L .˛/ C C
2
D .˛/
1
C
A
1=2
;
(12.17)
where the polynomial H is a function of angle of attack ˛
H.˛/ Á
L
D
D
C L .˛/
C D0 .˛/ C C Di .˛/
;
(12.18)
and ˇ z is the bank angle from [12.28] given as,
ˇ z D arcsinŒcos ' sin ˇ cos Á C .cos ˛ sin '
sin ˛ cos ' cos ˇ/ sin Á :
(12.19)
In (12.19), ' is the pitch angle, ˇ is the roll angle,
and Á is the yaw angle. In coordinated flight, Á D 0,
the bank angle approaches the angle of roll at small
pitch angles, i. e., ˇ z ! ˇ as ! 0. Positive values
of w in (12.17) correspond to ascending glides and
w < 0 corresponds to descending glides. The corresponding expression for u is the same as (12.17) except
that (a) only positive values of the horizontal speed are
considered (the glider does not fly backward) and (b)
H
2
.˛/ changes to H
2
.˛/. The glide polars of the XRay
flying wing glider (Fig. 12.11a) are plotted as solid
lines in Fig. 12.13 for noncircling, wings-level flight
at four different wing loadings within a potential range
of net buoyancy volume, n b D V b =V 0 D 3:8 to 27:6%.
The four polars in Fig. 12.13 (red, black, green, and
blue curves) are representative of various buoyancy engine technologies, where the red curve (V b D 38:36 L,
n b D 3:8%) is representative of the upper end of the
closed-loop liquid-based engine technology [12.2, 3],
the black curve (V b D 50:0 L, n b D 5:0%) represents
the upper range open-loop liquid-based engine technology [12.1, 4, 29], the green curve (V b D 122 L, n b D
12:2%) is a proxy for the open-loop compressed gasbased systems [12.8], and the blue curve (V b D 275 L,
n b D 27:6%) approximates the upper end of the openloop gas-based buoyancy engines that consume gas
generating compounds [12.5]. The magnitude of the
glide velocity, U, and the velocity components .u; v ; w /
increase as the square root of the buoyancy engine volume increase and the associated wing loading (ratio