

Autonomous Underwater Gliders 12.4 Optimal Size and Shape for Horizontal Transport Efficiency 313
Part B | 12.4
stant volume becomes
K 0 .2-D/
K 0 .3-D/
D
4
A t .2-D/
A t .3-D/
s
2.1 e 2 /
2 e 2 ; (12.16)
where e.0 Ä e Ä 1/ is the eccentricity of the ellipse
taken here as a proxy for the length-to-thickness ratio
(fineness) of the body. Equation (12.16) is consistent
with empirical data on drag of streamlined shapes at
high Reynolds numbers (turbulent flow regime) [12.22].
These empirical data relatively show higher profile drag
for 2-D shapes at small fineness ratios, as is the case
in (12.10) when e ! 0. The data for 3-D shapes develop
relatively higher profile drag at large fineness ratios, as
occurs with (12.16) when e ! 0:99. Both the empirical
data and (12.16) indicate a 2-D flying wing may suffer
as much as a 3-fold increase in K 0 relative to a 3-D body
of revolution. However, that increase is more than offset in (12.13) by a 9-fold reduction in N A when a flying
wing is compared to a winged body of revolution. For
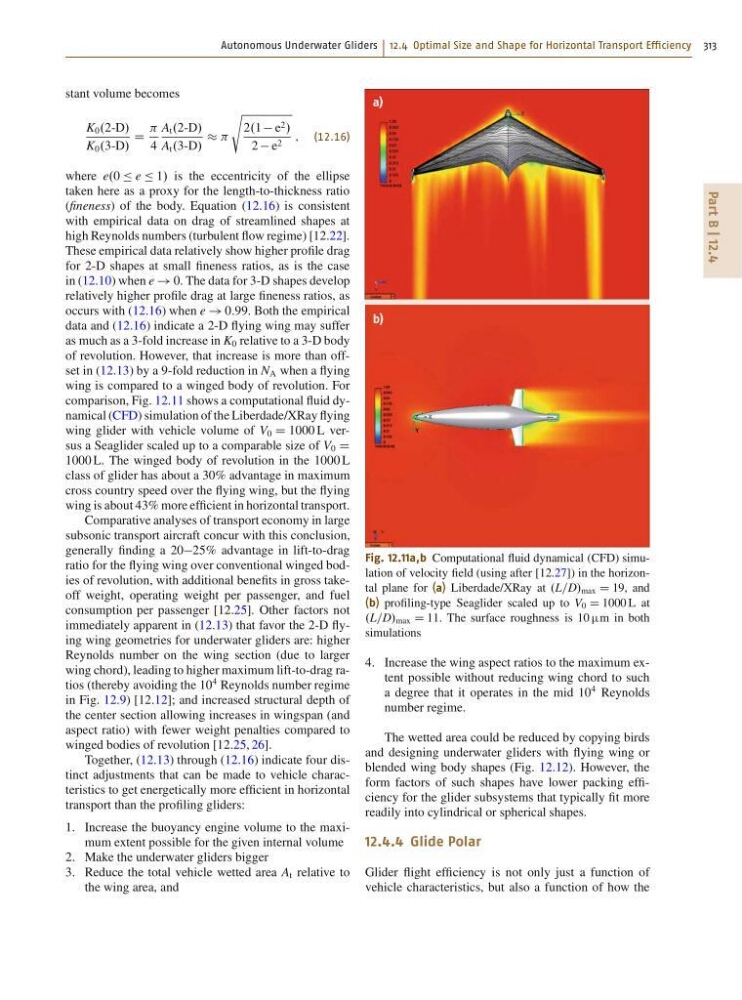
comparison, Fig. 12.11 shows a computational fluid dynamical (CFD) simulation of the Liberdade/XRay flying
wing glider with vehicle volume of V 0 D 1000 L versus a Seaglider scaled up to a comparable size of V 0 D
1000 L. The winged body of revolution in the 1000 L
class of glider has about a 30% advantage in maximum
cross country speed over the flying wing, but the flying
wing is about 43% more efficient in horizontal transport.
Comparative analyses of transport economy in large
subsonic transport aircraft concur with this conclusion,
generally finding a 2025% advantage in lift-to-drag
ratio for the flying wing over conventional winged bodies of revolution, with additional benefits in gross takeoff weight, operating weight per passenger, and fuel
consumption per passenger [12.25]. Other factors not
immediately apparent in (12.13) that favor the 2-D flying wing geometries for underwater gliders are: higher
Reynolds number on the wing section (due to larger
wing chord), leading to higher maximum lift-to-drag ratios (thereby avoiding the 10
4 Reynolds number regime
in Fig. 12.9) [12.12]; and increased structural depth of
the center section allowing increases in wingspan (and
aspect ratio) with fewer weight penalties compared to
winged bodies of revolution [12.25, 26].
Together, (12.13) through (12.16) indicate four distinct adjustments that can be made to vehicle characteristics to get energetically more efficient in horizontal
transport than the profiling gliders:
1. Increase the buoyancy engine volume to the maximum extent possible for the given internal volume
2. Make the underwater gliders bigger
3. Reduce the total vehicle wetted area A t relative to
the wing area, and
a)
b)
Fig. 12.11a,b Computational fluid dynamical (CFD) simulation of velocity field (using after [12.27]) in the horizontal plane for (a) Liberdade/XRay at .L=D/ max D 19, and
(b) profiling-type Seaglider scaled up to V 0 D 1000 L at
.L=D/ max D 11. The surface roughness is 10 m in both
simulations
4. Increase the wing aspect ratios to the maximum extent possible without reducing wing chord to such
a degree that it operates in the mid 10
4 Reynolds
number regime.
The wetted area could be reduced by copying birds
and designing underwater gliders with flying wing or
blended wing body shapes (Fig. 12.12). However, the
form factors of such shapes have lower packing efficiency for the glider subsystems that typically fit more
readily into cylindrical or spherical shapes.
12.4.4 Glide Polar
Glider flight efficiency is not only just a function of
vehicle characteristics, but also a function of how the
Part B | 12.4
stant volume becomes
K 0 .2-D/
K 0 .3-D/
D
4
A t .2-D/
A t .3-D/
s
2.1 e 2 /
2 e 2 ; (12.16)
where e.0 Ä e Ä 1/ is the eccentricity of the ellipse
taken here as a proxy for the length-to-thickness ratio
(fineness) of the body. Equation (12.16) is consistent
with empirical data on drag of streamlined shapes at
high Reynolds numbers (turbulent flow regime) [12.22].
These empirical data relatively show higher profile drag
for 2-D shapes at small fineness ratios, as is the case
in (12.10) when e ! 0. The data for 3-D shapes develop
relatively higher profile drag at large fineness ratios, as
occurs with (12.16) when e ! 0:99. Both the empirical
data and (12.16) indicate a 2-D flying wing may suffer
as much as a 3-fold increase in K 0 relative to a 3-D body
of revolution. However, that increase is more than offset in (12.13) by a 9-fold reduction in N A when a flying
wing is compared to a winged body of revolution. For
comparison, Fig. 12.11 shows a computational fluid dynamical (CFD) simulation of the Liberdade/XRay flying
wing glider with vehicle volume of V 0 D 1000 L versus a Seaglider scaled up to a comparable size of V 0 D
1000 L. The winged body of revolution in the 1000 L
class of glider has about a 30% advantage in maximum
cross country speed over the flying wing, but the flying
wing is about 43% more efficient in horizontal transport.
Comparative analyses of transport economy in large
subsonic transport aircraft concur with this conclusion,
generally finding a 2025% advantage in lift-to-drag
ratio for the flying wing over conventional winged bodies of revolution, with additional benefits in gross takeoff weight, operating weight per passenger, and fuel
consumption per passenger [12.25]. Other factors not
immediately apparent in (12.13) that favor the 2-D flying wing geometries for underwater gliders are: higher
Reynolds number on the wing section (due to larger
wing chord), leading to higher maximum lift-to-drag ratios (thereby avoiding the 10
4 Reynolds number regime
in Fig. 12.9) [12.12]; and increased structural depth of
the center section allowing increases in wingspan (and
aspect ratio) with fewer weight penalties compared to
winged bodies of revolution [12.25, 26].
Together, (12.13) through (12.16) indicate four distinct adjustments that can be made to vehicle characteristics to get energetically more efficient in horizontal
transport than the profiling gliders:
1. Increase the buoyancy engine volume to the maximum extent possible for the given internal volume
2. Make the underwater gliders bigger
3. Reduce the total vehicle wetted area A t relative to
the wing area, and
a)
b)
Fig. 12.11a,b Computational fluid dynamical (CFD) simulation of velocity field (using after [12.27]) in the horizontal plane for (a) Liberdade/XRay at .L=D/ max D 19, and
(b) profiling-type Seaglider scaled up to V 0 D 1000 L at
.L=D/ max D 11. The surface roughness is 10 m in both
simulations
4. Increase the wing aspect ratios to the maximum extent possible without reducing wing chord to such
a degree that it operates in the mid 10
4 Reynolds
number regime.
The wetted area could be reduced by copying birds
and designing underwater gliders with flying wing or
blended wing body shapes (Fig. 12.12). However, the
form factors of such shapes have lower packing efficiency for the glider subsystems that typically fit more
readily into cylindrical or spherical shapes.
12.4.4 Glide Polar
Glider flight efficiency is not only just a function of
vehicle characteristics, but also a function of how the