

Part A | 10.3
250 Part A Fundamentals
Control signal
Response (output)
The control signal
is not plotted
because it oscillates
at high frequency
between –15 and +15
0
2
4
6
8
A = 0.1
10
a)
Time (s)
1
0.8
0.6
0.4
0.2
0
0
2
4
6
8
A = 1
10
b)
Time (s)
1
0.8
0.6
0.4
0.2
0
0
2
4
6
8
A = 2
10
c)
Time (s)
2
1.8
1.6
1.4
1.2
1
0.8
0.6
0.4
0.2
0
0
2
4
6
8
A = 15
10
d)
Time (s)
1
0.8
0.6
0.4
0.2
0
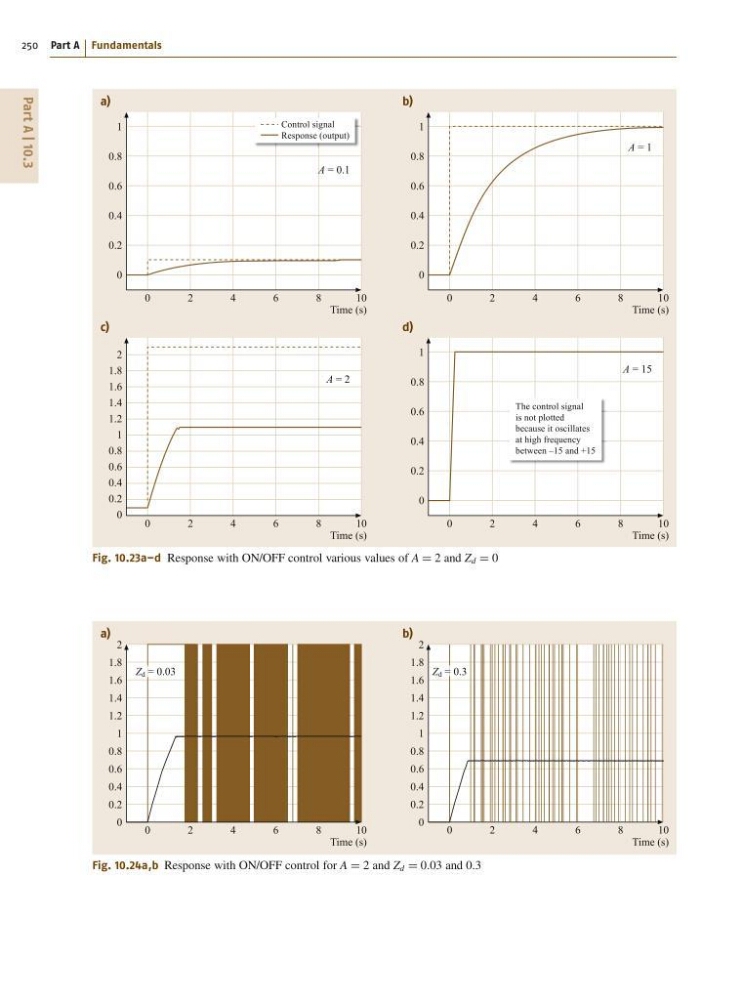
Fig. 10.23a–d Response with ON/OFF control various values of A D 2 and Z d D 0
0
2
4
6
8
Z d = 0.03
Z d = 0.3
10
a)
Time (s)
2
1.8
1.6
1.4
1.2
1
0.8
0.6
0.4
0.2
0
2
1.8
1.6
1.4
1.2
1
0.8
0.6
0.4
0.2
0
0
2
4
6
8
1 0
b)
Time (s)
Fig. 10.24a,b Response with ON/OFF control for A D 2 and Z d D 0:03 and 0.3
250 Part A Fundamentals
Control signal
Response (output)
The control signal
is not plotted
because it oscillates
at high frequency
between –15 and +15
0
2
4
6
8
A = 0.1
10
a)
Time (s)
1
0.8
0.6
0.4
0.2
0
0
2
4
6
8
A = 1
10
b)
Time (s)
1
0.8
0.6
0.4
0.2
0
0
2
4
6
8
A = 2
10
c)
Time (s)
2
1.8
1.6
1.4
1.2
1
0.8
0.6
0.4
0.2
0
0
2
4
6
8
A = 15
10
d)
Time (s)
1
0.8
0.6
0.4
0.2
0
Fig. 10.23a–d Response with ON/OFF control various values of A D 2 and Z d D 0
0
2
4
6
8
Z d = 0.03
Z d = 0.3
10
a)
Time (s)
2
1.8
1.6
1.4
1.2
1
0.8
0.6
0.4
0.2
0
2
1.8
1.6
1.4
1.2
1
0.8
0.6
0.4
0.2
0
0
2
4
6
8
1 0
b)
Time (s)
Fig. 10.24a,b Response with ON/OFF control for A D 2 and Z d D 0:03 and 0.3