

Part A | 7.1
146 Part A Fundamentals
propeller. One can quantify the magnitude of the wake
speed generated by a hull using the Taylor wake fraction, which is defined as
w Á
U S U
U S
:
(7.39)
For most ships, the wake fraction lies in the range
0 < w < 0:4, where a value of w 0:4 would correspond to a very full (rounded) hull and is smaller for
fine (slender) hulls.
The propulsion system and hull-form of a propellerdriven ship are typically designed separately. The barehull resistance R T (hull drag without propulsion system,
actuators, or rudders present) of the vessel is usually estimated from model test data. The performance of the
propulsion system is also usually estimated from open
water (no hull present) test data. However, the presence
of a propeller at the stern of a ship reduces the pressure
at the stern, in comparison to what it would be during bare hull resistance tests. This reduced pressure will
typically result in an increase in drag. Thus, the thrust
T required from the propeller is usually slightly higher
than the bare hull resistance. The thrust deduction coefficient t is a measure of the difference between required
thrust and bare hull resistance
t D
T R T
T
:
(7.40)
Generally, the thrust deduction coefficient is in the
range t < 0:2. From (7.32), the propulsive efficiency
can be expressed as the ratio of thrust power to propulsive power
Á p D
UR T
2nQ.1 t/
:
(7.41)
7.1.8 Air and Wind Resistance
When examining air drag on a surface-going vessel,
one must account for both the velocities of the vessel
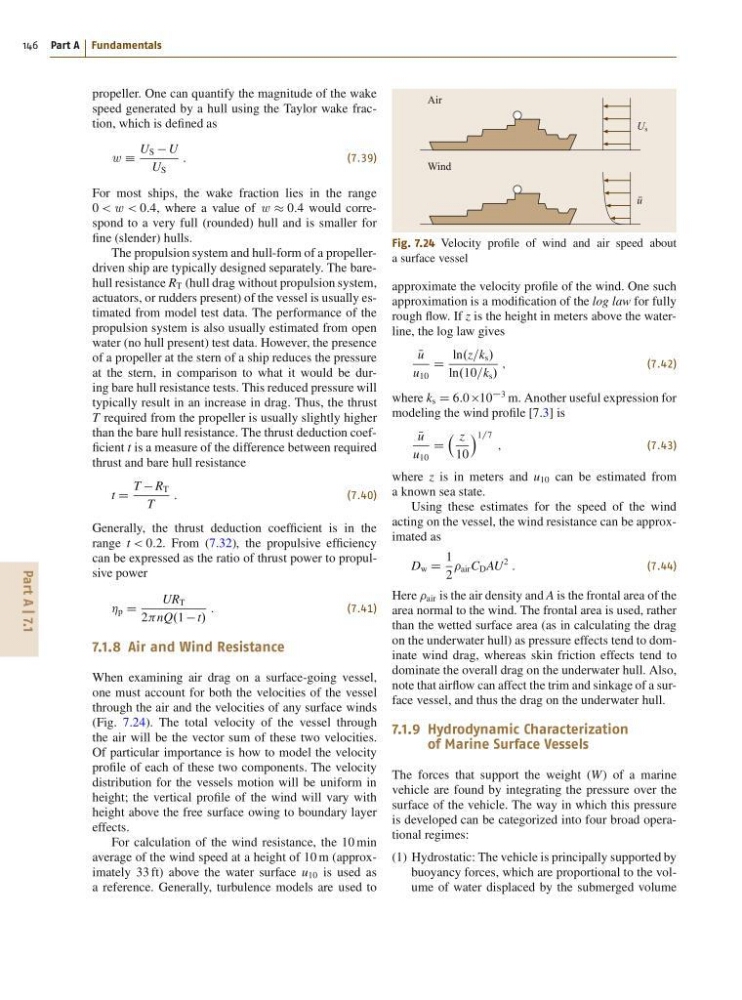
through the air and the velocities of any surface winds
(Fig. 7.24). The total velocity of the vessel through
the air will be the vector sum of these two velocities.
Of particular importance is how to model the velocity
profile of each of these two components. The velocity
distribution for the vessels motion will be uniform in
height; the vertical profile of the wind will vary with
height above the free surface owing to boundary layer
effects.
For calculation of the wind resistance, the 10 min
average of the wind speed at a height of 10 m (approximately 33 ft) above the water surface u 10 is used as
a reference. Generally, turbulence models are used to
Air
Wind
U s
u
Fig. 7.24 Velocity profile of wind and air speed about
a surface vessel
approximate the velocity profile of the wind. One such
approximation is a modification of the log law for fully
rough flow. If z is the height in meters above the waterline, the log law gives
N
u
u 10
D
ln.z=k s /
ln.10=k s /
;
(7.42)
where k s D 6:0 10
3 m. Another useful expression for
modeling the wind profile [7.3] is
N
u
u 10
D
z
10
Á 1=7 ;
(7.43)
where z is in meters and u 10 can be estimated from
a known sea state.
Using these estimates for the speed of the wind
acting on the vessel, the wind resistance can be approximated as
D w D
1
2
air C D AU
2
:
(7.44)
Here air is the air density and A is the frontal area of the
area normal to the wind. The frontal area is used, rather
than the wetted surface area (as in calculating the drag
on the underwater hull) as pressure effects tend to dominate wind drag, whereas skin friction effects tend to
dominate the overall drag on the underwater hull. Also,
note that airflow can affect the trim and sinkage of a surface vessel, and thus the drag on the underwater hull.
7.1.9 Hydrodynamic Characterization
of Marine Surface Vessels
The forces that support the weight (W) of a marine
vehicle are found by integrating the pressure over the
surface of the vehicle. The way in which this pressure
is developed can be categorized into four broad operational regimes:
(1) Hydrostatic: The vehicle is principally supported by
buoyancy forces, which are proportional to the volume of water displaced by the submerged volume
146 Part A Fundamentals
propeller. One can quantify the magnitude of the wake
speed generated by a hull using the Taylor wake fraction, which is defined as
w Á
U S U
U S
:
(7.39)
For most ships, the wake fraction lies in the range
0 < w < 0:4, where a value of w 0:4 would correspond to a very full (rounded) hull and is smaller for
fine (slender) hulls.
The propulsion system and hull-form of a propellerdriven ship are typically designed separately. The barehull resistance R T (hull drag without propulsion system,
actuators, or rudders present) of the vessel is usually estimated from model test data. The performance of the
propulsion system is also usually estimated from open
water (no hull present) test data. However, the presence
of a propeller at the stern of a ship reduces the pressure
at the stern, in comparison to what it would be during bare hull resistance tests. This reduced pressure will
typically result in an increase in drag. Thus, the thrust
T required from the propeller is usually slightly higher
than the bare hull resistance. The thrust deduction coefficient t is a measure of the difference between required
thrust and bare hull resistance
t D
T R T
T
:
(7.40)
Generally, the thrust deduction coefficient is in the
range t < 0:2. From (7.32), the propulsive efficiency
can be expressed as the ratio of thrust power to propulsive power
Á p D
UR T
2nQ.1 t/
:
(7.41)
7.1.8 Air and Wind Resistance
When examining air drag on a surface-going vessel,
one must account for both the velocities of the vessel
through the air and the velocities of any surface winds
(Fig. 7.24). The total velocity of the vessel through
the air will be the vector sum of these two velocities.
Of particular importance is how to model the velocity
profile of each of these two components. The velocity
distribution for the vessels motion will be uniform in
height; the vertical profile of the wind will vary with
height above the free surface owing to boundary layer
effects.
For calculation of the wind resistance, the 10 min
average of the wind speed at a height of 10 m (approximately 33 ft) above the water surface u 10 is used as
a reference. Generally, turbulence models are used to
Air
Wind
U s
u
Fig. 7.24 Velocity profile of wind and air speed about
a surface vessel
approximate the velocity profile of the wind. One such
approximation is a modification of the log law for fully
rough flow. If z is the height in meters above the waterline, the log law gives
N
u
u 10
D
ln.z=k s /
ln.10=k s /
;
(7.42)
where k s D 6:0 10
3 m. Another useful expression for
modeling the wind profile [7.3] is
N
u
u 10
D
z
10
Á 1=7 ;
(7.43)
where z is in meters and u 10 can be estimated from
a known sea state.
Using these estimates for the speed of the wind
acting on the vessel, the wind resistance can be approximated as
D w D
1
2
air C D AU
2
:
(7.44)
Here air is the air density and A is the frontal area of the
area normal to the wind. The frontal area is used, rather
than the wetted surface area (as in calculating the drag
on the underwater hull) as pressure effects tend to dominate wind drag, whereas skin friction effects tend to
dominate the overall drag on the underwater hull. Also,
note that airflow can affect the trim and sinkage of a surface vessel, and thus the drag on the underwater hull.
7.1.9 Hydrodynamic Characterization
of Marine Surface Vessels
The forces that support the weight (W) of a marine
vehicle are found by integrating the pressure over the
surface of the vehicle. The way in which this pressure
is developed can be categorized into four broad operational regimes:
(1) Hydrostatic: The vehicle is principally supported by
buoyancy forces, which are proportional to the volume of water displaced by the submerged volume