

Part A | 5.4
104 Part A Fundamentals
33
35
34
36 37
Salinity (psu)
Depth (m)
Atlantic
Low and
mid lat.
High
lat.
33
35
34
36
Pacific
Low
and
mid
lat.
High
lat.
33
35
34
36 37
Tropics
0
100
2000
3000
4000
500
4000
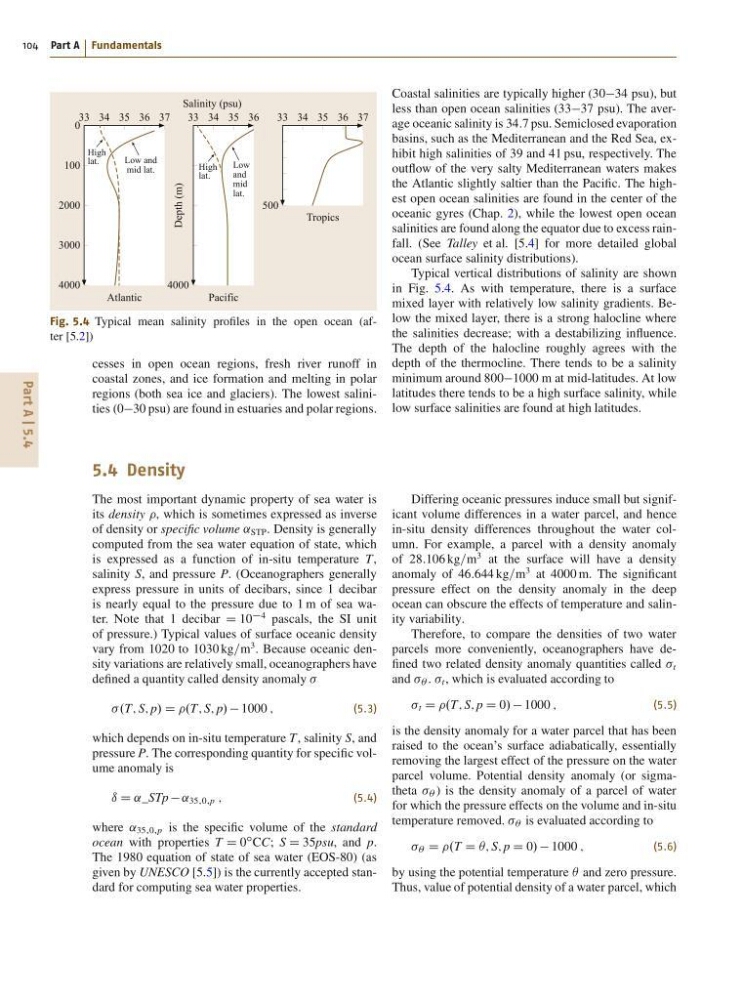
Fig. 5.4 Typical mean salinity profiles in the open ocean (after [5.2])
cesses in open ocean regions, fresh river runoff in
coastal zones, and ice formation and melting in polar
regions (both sea ice and glaciers). The lowest salinities (030 psu) are found in estuaries and polar regions.
Coastal salinities are typically higher (3034 psu), but
less than open ocean salinities (3337 psu). The average oceanic salinity is 34:7 psu. Semiclosed evaporation
basins, such as the Mediterranean and the Red Sea, exhibit high salinities of 39 and 41 psu, respectively. The
outflow of the very salty Mediterranean waters makes
the Atlantic slightly saltier than the Pacific. The highest open ocean salinities are found in the center of the
oceanic gyres (Chap. 2), while the lowest open ocean
salinities are found along the equator due to excess rainfall. (See Talley et al. [5.4] for more detailed global
ocean surface salinity distributions).
Typical vertical distributions of salinity are shown
in Fig. 5.4. As with temperature, there is a surface
mixed layer with relatively low salinity gradients. Below the mixed layer, there is a strong halocline where
the salinities decrease; with a destabilizing influence.
The depth of the halocline roughly agrees with the
depth of the thermocline. There tends to be a salinity
minimum around 8001000 m at mid-latitudes. At low
latitudes there tends to be a high surface salinity, while
low surface salinities are found at high latitudes.
5.4 Density
The most important dynamic property of sea water is
its density , which is sometimes expressed as inverse
of density or specific volume ˛ STP . Density is generally
computed from the sea water equation of state, which
is expressed as a function of in-situ temperature T,
salinity S, and pressure P. (Oceanographers generally
express pressure in units of decibars, since 1 decibar
is nearly equal to the pressure due to 1 m of sea water. Note that 1 decibar D 10
4 pascals, the SI unit
of pressure.) Typical values of surface oceanic density
vary from 1020 to 1030 kg=m
3 . Because oceanic density variations are relatively small, oceanographers have
defined a quantity called density anomaly
.T; S; p/ D .T; S; p/ 1000 ;
(5.3)
which depends on in-situ temperature T, salinity S, and
pressure P. The corresponding quantity for specific volume anomaly is
ı D ˛_STp ˛ 35;0;p ;
(5.4)
where ˛ 35;0;p is the specific volume of the standard
ocean with properties T D 0
ı CC; S D 35psu, and p.
The 1980 equation of state of sea water (EOS-80) (as
given by UNESCO [5.5]) is the currently accepted standard for computing sea water properties.
Differing oceanic pressures induce small but significant volume differences in a water parcel, and hence
in-situ density differences throughout the water column. For example, a parcel with a density anomaly
of 28:106 kg=m
3 at the surface will have a density
anomaly of 46:644 kg=m
3 at 4000 m. The significant
pressure effect on the density anomaly in the deep
ocean can obscure the effects of temperature and salinity variability.
Therefore, to compare the densities of two water
parcels more conveniently, oceanographers have defined two related density anomaly quantities called t
and  . t , which is evaluated according to
t D .T; S; p D 0/ 1000 ;
(5.5)
is the density anomaly for a water parcel that has been
raised to the ocean’s surface adiabatically, essentially
removing the largest effect of the pressure on the water
parcel volume. Potential density anomaly (or sigmatheta  ) is the density anomaly of a parcel of water
for which the pressure effects on the volume and in-situ
temperature removed. Â is evaluated according to
 D .T D Â; S; p D 0/ 1000 ;
(5.6)
by using the potential temperature  and zero pressure.
Thus, value of potential density of a water parcel, which
104 Part A Fundamentals
33
35
34
36 37
Salinity (psu)
Depth (m)
Atlantic
Low and
mid lat.
High
lat.
33
35
34
36
Pacific
Low
and
mid
lat.
High
lat.
33
35
34
36 37
Tropics
0
100
2000
3000
4000
500
4000
Fig. 5.4 Typical mean salinity profiles in the open ocean (after [5.2])
cesses in open ocean regions, fresh river runoff in
coastal zones, and ice formation and melting in polar
regions (both sea ice and glaciers). The lowest salinities (030 psu) are found in estuaries and polar regions.
Coastal salinities are typically higher (3034 psu), but
less than open ocean salinities (3337 psu). The average oceanic salinity is 34:7 psu. Semiclosed evaporation
basins, such as the Mediterranean and the Red Sea, exhibit high salinities of 39 and 41 psu, respectively. The
outflow of the very salty Mediterranean waters makes
the Atlantic slightly saltier than the Pacific. The highest open ocean salinities are found in the center of the
oceanic gyres (Chap. 2), while the lowest open ocean
salinities are found along the equator due to excess rainfall. (See Talley et al. [5.4] for more detailed global
ocean surface salinity distributions).
Typical vertical distributions of salinity are shown
in Fig. 5.4. As with temperature, there is a surface
mixed layer with relatively low salinity gradients. Below the mixed layer, there is a strong halocline where
the salinities decrease; with a destabilizing influence.
The depth of the halocline roughly agrees with the
depth of the thermocline. There tends to be a salinity
minimum around 8001000 m at mid-latitudes. At low
latitudes there tends to be a high surface salinity, while
low surface salinities are found at high latitudes.
5.4 Density
The most important dynamic property of sea water is
its density , which is sometimes expressed as inverse
of density or specific volume ˛ STP . Density is generally
computed from the sea water equation of state, which
is expressed as a function of in-situ temperature T,
salinity S, and pressure P. (Oceanographers generally
express pressure in units of decibars, since 1 decibar
is nearly equal to the pressure due to 1 m of sea water. Note that 1 decibar D 10
4 pascals, the SI unit
of pressure.) Typical values of surface oceanic density
vary from 1020 to 1030 kg=m
3 . Because oceanic density variations are relatively small, oceanographers have
defined a quantity called density anomaly
.T; S; p/ D .T; S; p/ 1000 ;
(5.3)
which depends on in-situ temperature T, salinity S, and
pressure P. The corresponding quantity for specific volume anomaly is
ı D ˛_STp ˛ 35;0;p ;
(5.4)
where ˛ 35;0;p is the specific volume of the standard
ocean with properties T D 0
ı CC; S D 35psu, and p.
The 1980 equation of state of sea water (EOS-80) (as
given by UNESCO [5.5]) is the currently accepted standard for computing sea water properties.
Differing oceanic pressures induce small but significant volume differences in a water parcel, and hence
in-situ density differences throughout the water column. For example, a parcel with a density anomaly
of 28:106 kg=m
3 at the surface will have a density
anomaly of 46:644 kg=m
3 at 4000 m. The significant
pressure effect on the density anomaly in the deep
ocean can obscure the effects of temperature and salinity variability.
Therefore, to compare the densities of two water
parcels more conveniently, oceanographers have defined two related density anomaly quantities called t
and  . t , which is evaluated according to
t D .T; S; p D 0/ 1000 ;
(5.5)
is the density anomaly for a water parcel that has been
raised to the ocean’s surface adiabatically, essentially
removing the largest effect of the pressure on the water
parcel volume. Potential density anomaly (or sigmatheta  ) is the density anomaly of a parcel of water
for which the pressure effects on the volume and in-situ
temperature removed. Â is evaluated according to
 D .T D Â; S; p D 0/ 1000 ;
(5.6)
by using the potential temperature  and zero pressure.
Thus, value of potential density of a water parcel, which