

Physical Properties of Seawater 5.3 Salinity 103
Part A | 5.3
measured or in-situ temperature T at a rate of about
1:4 10
4 ı C=m – the adiabatic temperature gradient.
For example, if a parcel with a temperature of 5:000
ı C
at the surface were lowered to a 4000 m depth, the
temperature would increase to 5:438
ı C. Conversely,
if a parcel of sea water with an in-situ temperature of
5:000
ı C at a 4000 m depth were raised adiabatically
to the surface, then its in-situ temperature would decrease to 4:574
ı C. (The difference in these two thought
experiments is related to the compression process nonlinearity; something that is reflected in the equation of
state of the water.) This pressure-induced temperature
gradient is imposed on all water parcels uniformly and
thus does not contribute to the buoyancy of a particular water parcel relative to the other surrounding water
parcels.
So as to focus on the buoyancy-related temperature
differences of water parcels, oceanographers define
a potential temperature  , which is the in-situ temperature that has been corrected mathematically for
the compressibility effects described above. Generally,
oceanographers correct in-situ temperatures to the
ocean surface pressure which is zero gauge pressure.
However, when comparing the temperatures of two
water parcels at great depths, it is sometimes more
accurate (because of the process nonlinearities) to
correct to a common or a standard nonzero pressure or
zeroperfect.
5.3 Salinity
Historically, ocean salinity was determined by the
chemical titration of a sample collected in a bottle lowered on a wire from the ship. This titration-determined
the chlorinity Cl of sea water (in units of parts per
thousand – ‰) was directly related to salinity by the
empirical Knudsen relation
S Œpsu D 0:03 C 1:805 Cl Œ‰ :
In the 1970s, considerable research was conducted on
both the definition/measurement of conductivity and
equation of state of sea water from which to calculate
salinity. This work led to the adoption of the practical salinity scale of 1978 (PSS-78). (For details [5.5])
While modern computers enable the computation of
salinity from these well-known complicated set of re35
33
34
33
32
30
35.5
36
36.5
35
35
35
36
34
35
35 35
35
36
36
37
37
37.3
32
32
30
37 38 39
37
36
35
30
25
5
36
36
37.3
34
34
34
33
36
20° S
0°
40°
60° S
60° S
Surface salinity (psu)
August
20° S
33
35
36
40°
35
34
34
34
34
34
34
34
33
34
34
40°
Bay of
Bengal
Arabian
sea
20
38
38
37
41
40
35
60° N
32
32
30
90° E
180°
90° W 0°
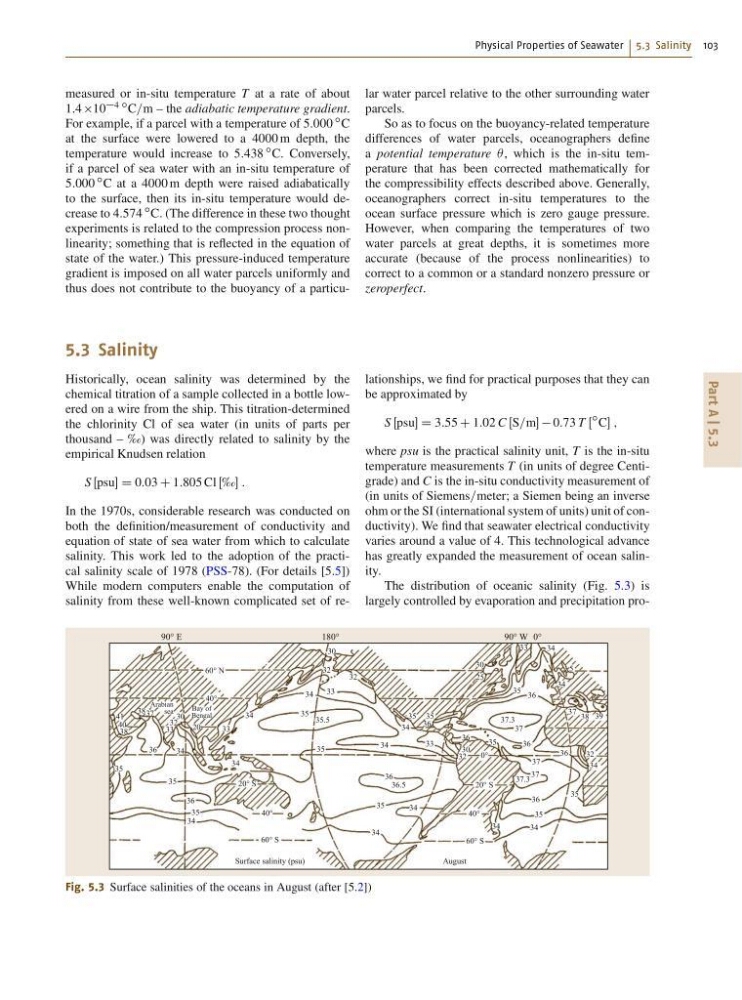
Fig. 5.3 Surface salinities of the oceans in August (after [5.2])
lationships, we find for practical purposes that they can
be approximated by
S Œpsu D 3:55 C 1:02 C ŒS=m 0:73 T Œ
ı C ;
where psu is the practical salinity unit, T is the in-situ
temperature measurements T (in units of degree Centigrade) and C is the in-situ conductivity measurement of
(in units of Siemens=meter; a Siemen being an inverse
ohm or the SI (international system of units) unit of conductivity). We find that seawater electrical conductivity
varies around a value of 4. This technological advance
has greatly expanded the measurement of ocean salinity.
The distribution of oceanic salinity (Fig. 5.3) is
largely controlled by evaporation and precipitation pro-
Part A | 5.3
measured or in-situ temperature T at a rate of about
1:4 10
4 ı C=m – the adiabatic temperature gradient.
For example, if a parcel with a temperature of 5:000
ı C
at the surface were lowered to a 4000 m depth, the
temperature would increase to 5:438
ı C. Conversely,
if a parcel of sea water with an in-situ temperature of
5:000
ı C at a 4000 m depth were raised adiabatically
to the surface, then its in-situ temperature would decrease to 4:574
ı C. (The difference in these two thought
experiments is related to the compression process nonlinearity; something that is reflected in the equation of
state of the water.) This pressure-induced temperature
gradient is imposed on all water parcels uniformly and
thus does not contribute to the buoyancy of a particular water parcel relative to the other surrounding water
parcels.
So as to focus on the buoyancy-related temperature
differences of water parcels, oceanographers define
a potential temperature  , which is the in-situ temperature that has been corrected mathematically for
the compressibility effects described above. Generally,
oceanographers correct in-situ temperatures to the
ocean surface pressure which is zero gauge pressure.
However, when comparing the temperatures of two
water parcels at great depths, it is sometimes more
accurate (because of the process nonlinearities) to
correct to a common or a standard nonzero pressure or
zeroperfect.
5.3 Salinity
Historically, ocean salinity was determined by the
chemical titration of a sample collected in a bottle lowered on a wire from the ship. This titration-determined
the chlorinity Cl of sea water (in units of parts per
thousand – ‰) was directly related to salinity by the
empirical Knudsen relation
S Œpsu D 0:03 C 1:805 Cl Œ‰ :
In the 1970s, considerable research was conducted on
both the definition/measurement of conductivity and
equation of state of sea water from which to calculate
salinity. This work led to the adoption of the practical salinity scale of 1978 (PSS-78). (For details [5.5])
While modern computers enable the computation of
salinity from these well-known complicated set of re35
33
34
33
32
30
35.5
36
36.5
35
35
35
36
34
35
35 35
35
36
36
37
37
37.3
32
32
30
37 38 39
37
36
35
30
25
5
36
36
37.3
34
34
34
33
36
20° S
0°
40°
60° S
60° S
Surface salinity (psu)
August
20° S
33
35
36
40°
35
34
34
34
34
34
34
34
33
34
34
40°
Bay of
Bengal
Arabian
sea
20
38
38
37
41
40
35
60° N
32
32
30
90° E
180°
90° W 0°
Fig. 5.3 Surface salinities of the oceans in August (after [5.2])
lationships, we find for practical purposes that they can
be approximated by
S Œpsu D 3:55 C 1:02 C ŒS=m 0:73 T Œ
ı C ;
where psu is the practical salinity unit, T is the in-situ
temperature measurements T (in units of degree Centigrade) and C is the in-situ conductivity measurement of
(in units of Siemens=meter; a Siemen being an inverse
ohm or the SI (international system of units) unit of conductivity). We find that seawater electrical conductivity
varies around a value of 4. This technological advance
has greatly expanded the measurement of ocean salinity.
The distribution of oceanic salinity (Fig. 5.3) is
largely controlled by evaporation and precipitation pro-