

Part A | 5.2
102 Part A Fundamentals
Surface
temperature
28
29
29
28
28
25
25
25
25
25
20
20
20
20
25
25
25
25
25
28
29
20°
0°
40°
60° S
20
20
15
15
15
15
15
10
10
10
10
10 5
5
5
5
5
1
–1
0
0
0
0
0
10
40°
20°
32 30
30
30
60° N
5
0
90° E
180°
90° W 0°
August
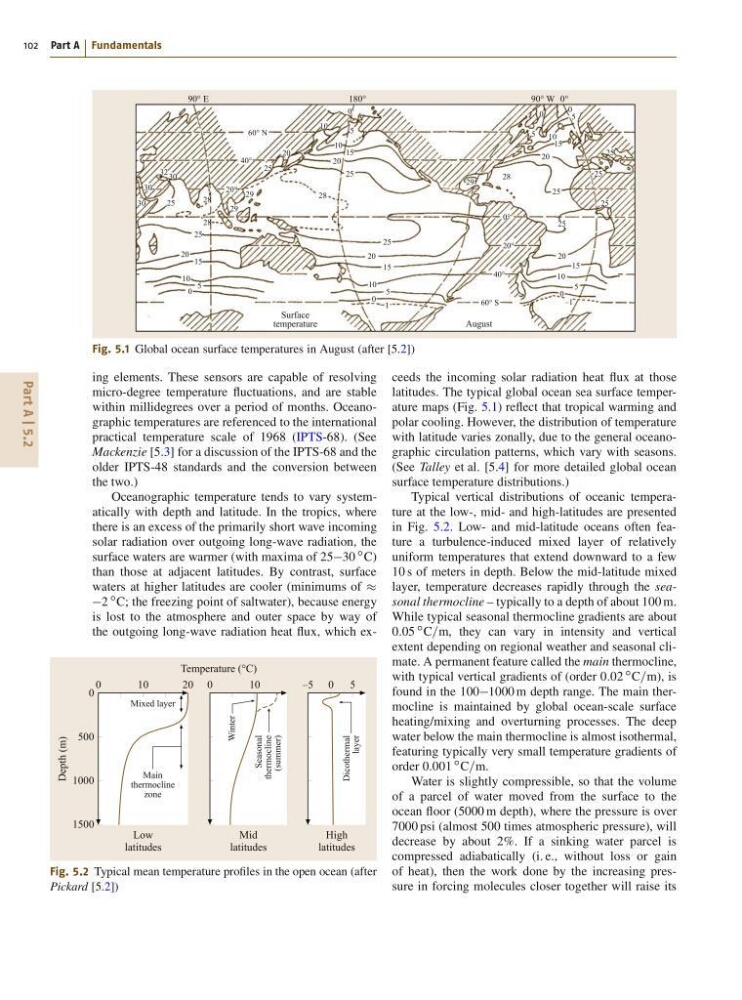
Fig. 5.1 Global ocean surface temperatures in August (after [5.2])
ing elements. These sensors are capable of resolving
micro-degree temperature fluctuations, and are stable
within millidegrees over a period of months. Oceanographic temperatures are referenced to the international
practical temperature scale of 1968 (IPTS-68). (See
Mackenzie [5.3] for a discussion of the IPTS-68 and the
older IPTS-48 standards and the conversion between
the two.)
Oceanographic temperature tends to vary systematically with depth and latitude. In the tropics, where
there is an excess of the primarily short wave incoming
solar radiation over outgoing long-wave radiation, the
surface waters are warmer (with maxima of 2530
ı C)
than those at adjacent latitudes. By contrast, surface
waters at higher latitudes are cooler (minimums of
2
ı C; the freezing point of saltwater), because energy
is lost to the atmosphere and outer space by way of
the outgoing long-wave radiation heat flux, which ex0
1 0
2 0
Depth (m)
Temperature (°C)
Low
latitudes
Mid
latitudes
Main
thermocline
zone
Seasonal
thermocline
(summer)
Winter
Dicothermal
layer
Mixed layer
0
1 0
High
latitudes
–5 0 5
0
500
1000
1500
Fig. 5.2 Typical mean temperature profiles in the open ocean (after
Pickard [5.2])
ceeds the incoming solar radiation heat flux at those
latitudes. The typical global ocean sea surface temperature maps (Fig. 5.1) reflect that tropical warming and
polar cooling. However, the distribution of temperature
with latitude varies zonally, due to the general oceanographic circulation patterns, which vary with seasons.
(See Talley et al. [5.4] for more detailed global ocean
surface temperature distributions.)
Typical vertical distributions of oceanic temperature at the low-, mid- and high-latitudes are presented
in Fig. 5.2. Low- and mid-latitude oceans often feature a turbulence-induced mixed layer of relatively
uniform temperatures that extend downward to a few
10 s of meters in depth. Below the mid-latitude mixed
layer, temperature decreases rapidly through the seasonal thermocline – typically to a depth of about 100 m.
While typical seasonal thermocline gradients are about
0:05
ı C=m, they can vary in intensity and vertical
extent depending on regional weather and seasonal climate. A permanent feature called the main thermocline,
with typical vertical gradients of (order 0:02
ı C=m), is
found in the 1001000 m depth range. The main thermocline is maintained by global ocean-scale surface
heating/mixing and overturning processes. The deep
water below the main thermocline is almost isothermal,
featuring typically very small temperature gradients of
order 0:001
ı C=m.
Water is slightly compressible, so that the volume
of a parcel of water moved from the surface to the
ocean floor (5000 m depth), where the pressure is over
7000 psi (almost 500 times atmospheric pressure), will
decrease by about 2%. If a sinking water parcel is
compressed adiabatically (i. e., without loss or gain
of heat), then the work done by the increasing pressure in forcing molecules closer together will raise its
102 Part A Fundamentals
Surface
temperature
28
29
29
28
28
25
25
25
25
25
20
20
20
20
25
25
25
25
25
28
29
20°
0°
40°
60° S
20
20
15
15
15
15
15
10
10
10
10
10 5
5
5
5
5
1
–1
0
0
0
0
0
10
40°
20°
32 30
30
30
60° N
5
0
90° E
180°
90° W 0°
August
Fig. 5.1 Global ocean surface temperatures in August (after [5.2])
ing elements. These sensors are capable of resolving
micro-degree temperature fluctuations, and are stable
within millidegrees over a period of months. Oceanographic temperatures are referenced to the international
practical temperature scale of 1968 (IPTS-68). (See
Mackenzie [5.3] for a discussion of the IPTS-68 and the
older IPTS-48 standards and the conversion between
the two.)
Oceanographic temperature tends to vary systematically with depth and latitude. In the tropics, where
there is an excess of the primarily short wave incoming
solar radiation over outgoing long-wave radiation, the
surface waters are warmer (with maxima of 2530
ı C)
than those at adjacent latitudes. By contrast, surface
waters at higher latitudes are cooler (minimums of
2
ı C; the freezing point of saltwater), because energy
is lost to the atmosphere and outer space by way of
the outgoing long-wave radiation heat flux, which ex0
1 0
2 0
Depth (m)
Temperature (°C)
Low
latitudes
Mid
latitudes
Main
thermocline
zone
Seasonal
thermocline
(summer)
Winter
Dicothermal
layer
Mixed layer
0
1 0
High
latitudes
–5 0 5
0
500
1000
1500
Fig. 5.2 Typical mean temperature profiles in the open ocean (after
Pickard [5.2])
ceeds the incoming solar radiation heat flux at those
latitudes. The typical global ocean sea surface temperature maps (Fig. 5.1) reflect that tropical warming and
polar cooling. However, the distribution of temperature
with latitude varies zonally, due to the general oceanographic circulation patterns, which vary with seasons.
(See Talley et al. [5.4] for more detailed global ocean
surface temperature distributions.)
Typical vertical distributions of oceanic temperature at the low-, mid- and high-latitudes are presented
in Fig. 5.2. Low- and mid-latitude oceans often feature a turbulence-induced mixed layer of relatively
uniform temperatures that extend downward to a few
10 s of meters in depth. Below the mid-latitude mixed
layer, temperature decreases rapidly through the seasonal thermocline – typically to a depth of about 100 m.
While typical seasonal thermocline gradients are about
0:05
ı C=m, they can vary in intensity and vertical
extent depending on regional weather and seasonal climate. A permanent feature called the main thermocline,
with typical vertical gradients of (order 0:02
ı C=m), is
found in the 1001000 m depth range. The main thermocline is maintained by global ocean-scale surface
heating/mixing and overturning processes. The deep
water below the main thermocline is almost isothermal,
featuring typically very small temperature gradients of
order 0:001
ı C=m.
Water is slightly compressible, so that the volume
of a parcel of water moved from the surface to the
ocean floor (5000 m depth), where the pressure is over
7000 psi (almost 500 times atmospheric pressure), will
decrease by about 2%. If a sinking water parcel is
compressed adiabatically (i. e., without loss or gain
of heat), then the work done by the increasing pressure in forcing molecules closer together will raise its