

48
Multiscale Hydrologic Remote Sensing: Perspectives and Applications
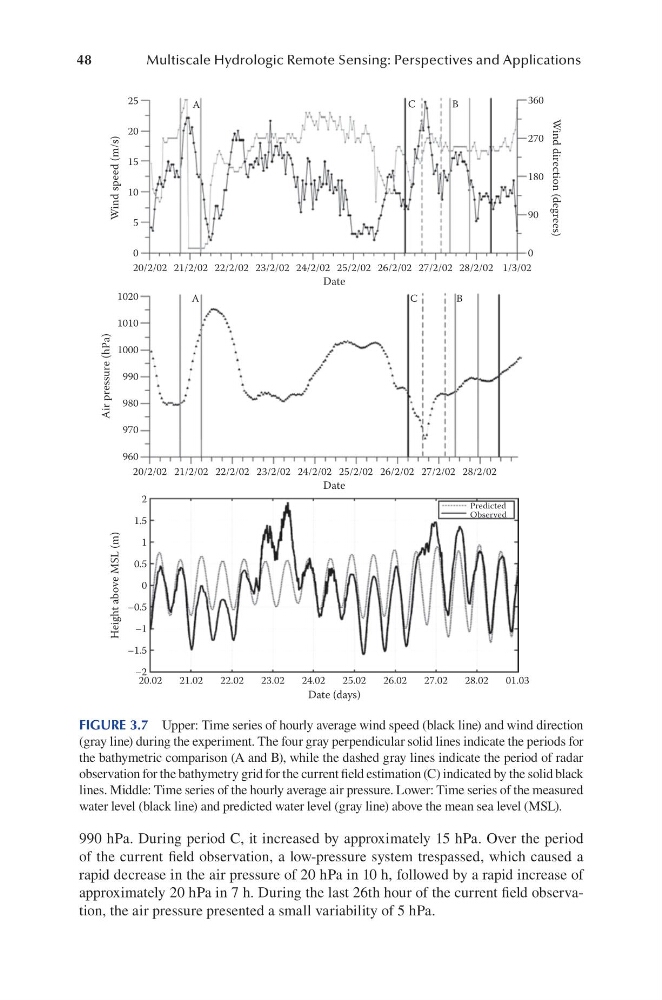
990 hPa. During period C, it increased by approximately 15 hPa. Over the period
of the current field observation, a low-pressure system trespassed, which caused a
rapid decrease in the air pressure of 20 hPa in 10 h, followed by a rapid increase of
approximately 20 hPa in 7 h. During the last 26th hour of the current field observation, the air pressure presented a small variability of 5 hPa.
25
20
15
1020
A
C
B
1010
1000
990
980
970
2
1.5
0.5
–0.5
–1
–1.5
–2
1
0
960
10
5
0
20/2/02 21/2/02 22/2/02 23/2/02 24/2/02 25/2/02 26/2/02 27/2/02 28/2/02
20/2/02
20.02
21.02
22.02
23.02
24.02
25.02
26.02
27.02
28.02
01.03
21/2/02 22/2/02 23/2/02 24/2/02 25/2/02 26/2/02 27/2/02 28/2/02
1/3/02
360
270
180
90
0
Date
Wind speed (m/s)
Wind direction (degrees)
Air pressure (hPa)
Height above MSL (m)
Date
Predicted
Observed
Date (days)
A
C
B
FIGURE 3.7 Upper: Time series of hourly average wind speed (black line) and wind direction
(gray line) during the experiment. The four gray perpendicular solid lines indicate the periods for
the bathymetric comparison (A and B), while the dashed gray lines indicate the period of radar
observation for the bathymetry grid for the current field estimation (C) indicated by the solid black
lines. Middle: Time series of the hourly average air pressure. Lower: Time series of the measured
water level (black line) and predicted water level (gray line) above the mean sea level (MSL).
Multiscale Hydrologic Remote Sensing: Perspectives and Applications
990 hPa. During period C, it increased by approximately 15 hPa. Over the period
of the current field observation, a low-pressure system trespassed, which caused a
rapid decrease in the air pressure of 20 hPa in 10 h, followed by a rapid increase of
approximately 20 hPa in 7 h. During the last 26th hour of the current field observation, the air pressure presented a small variability of 5 hPa.
25
20
15
1020
A
C
B
1010
1000
990
980
970
2
1.5
0.5
–0.5
–1
–1.5
–2
1
0
960
10
5
0
20/2/02 21/2/02 22/2/02 23/2/02 24/2/02 25/2/02 26/2/02 27/2/02 28/2/02
20/2/02
20.02
21.02
22.02
23.02
24.02
25.02
26.02
27.02
28.02
01.03
21/2/02 22/2/02 23/2/02 24/2/02 25/2/02 26/2/02 27/2/02 28/2/02
1/3/02
360
270
180
90
0
Date
Wind speed (m/s)
Wind direction (degrees)
Air pressure (hPa)
Height above MSL (m)
Date
Predicted
Observed
Date (days)
A
C
B
FIGURE 3.7 Upper: Time series of hourly average wind speed (black line) and wind direction
(gray line) during the experiment. The four gray perpendicular solid lines indicate the periods for
the bathymetric comparison (A and B), while the dashed gray lines indicate the period of radar
observation for the bathymetry grid for the current field estimation (C) indicated by the solid black
lines. Middle: Time series of the hourly average air pressure. Lower: Time series of the measured
water level (black line) and predicted water level (gray line) above the mean sea level (MSL).