

47
Storm Impact on the Coastal Geomorphology and Current Field
3.5 BATHYMETRIC AND CURRENT FIELD MONITORING
DURING A STORM: THE SYLT ISLAND CASE STUDY
The extended validation of DiSC permits the application of the method for the monitoring of bathymetry and the current field. In this section of the investigation, oceanographic and meteorological observations are integrated for the identification of a
10-day storm’s impact, which includes the local bathymetry as well as the current
field during the trespassing of a low-atmospheric-pressure system across the coastal
area of northern Sylt Island. Both quantities are extracted by applying the DiSC algorithm on a time series of radar image sequences, which are acquired every 30 min.
This effort is one of the few studies on geomorphology due to one individual storm,
and it also is the first time that there are time series of current field measurements in
the coastal area during a severe storm.
3.5.1 MeteoRological and oceanogRaPhic conditionS
During the last decade, radar data have been acquired under different meteorological
and oceanographic conditions. This study is focused on the severe storm of the last 10
days of February 2002 (February 20–28, 2002). For this event, 100 radar data sets have
been analyzed. These data sets correspond to three different periods: period A, February
20–21; period B, February 27; and period C, February 26–28. Periods A and B are used
for extraction of the bathymetry, and period C is used for calculation of the current field.
The storm began as a coalescing low-pressure system crossing the North Sea with
a W, NW direction, February 20–21. A second low-pressure system passed between
February 22 and 24, and on the 26th, there is the trespassing of an extreme low
front, which causes the most severe effects. The direction of the last two systems is
westerly. The wind speed for the 10-day period of data acquisition was stronger than
8 m/s (75% of the data), and more than 10% of the wind measurements exceed the
20-m/s threshold. The directional wind window is southwest to west, and only less
than 5% is from a different direction, which mainly was from the north. As displayed
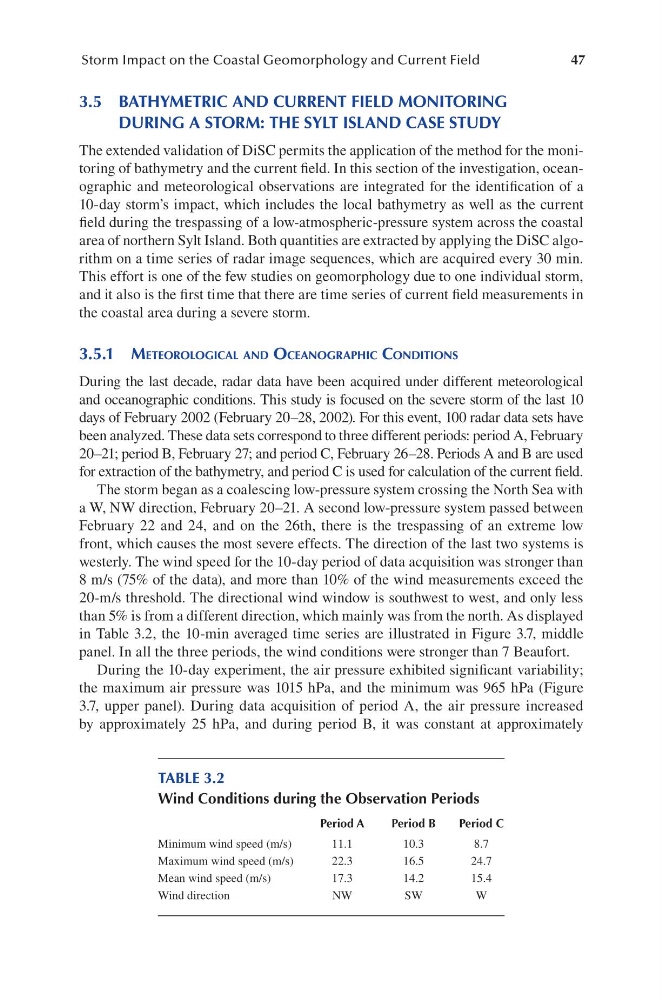
in Table 3.2, the 10-min averaged time series are illustrated in Figure 3.7, middle
panel. In all the three periods, the wind conditions were stronger than 7 Beaufort.
During the 10-day experiment, the air pressure exhibited significant variability;
the maximum air pressure was 1015 hPa, and the minimum was 965 hPa (Figure
3.7, upper panel). During data acquisition of period A, the air pressure increased
by approximately 25 hPa, and during period B, it was constant at approximately
TABLE 3.2
Wind Conditions during the Observation Periods
Period A
Period B
Period C
Minimum wind speed (m/s)
11.1
10.3
8.7
Maximum wind speed (m/s)
22.3
16.5
24.7
Mean wind speed (m/s)
17.3
14.2
15.4
Wind direction
NW
SW
W
Storm Impact on the Coastal Geomorphology and Current Field
3.5 BATHYMETRIC AND CURRENT FIELD MONITORING
DURING A STORM: THE SYLT ISLAND CASE STUDY
The extended validation of DiSC permits the application of the method for the monitoring of bathymetry and the current field. In this section of the investigation, oceanographic and meteorological observations are integrated for the identification of a
10-day storm’s impact, which includes the local bathymetry as well as the current
field during the trespassing of a low-atmospheric-pressure system across the coastal
area of northern Sylt Island. Both quantities are extracted by applying the DiSC algorithm on a time series of radar image sequences, which are acquired every 30 min.
This effort is one of the few studies on geomorphology due to one individual storm,
and it also is the first time that there are time series of current field measurements in
the coastal area during a severe storm.
3.5.1 MeteoRological and oceanogRaPhic conditionS
During the last decade, radar data have been acquired under different meteorological
and oceanographic conditions. This study is focused on the severe storm of the last 10
days of February 2002 (February 20–28, 2002). For this event, 100 radar data sets have
been analyzed. These data sets correspond to three different periods: period A, February
20–21; period B, February 27; and period C, February 26–28. Periods A and B are used
for extraction of the bathymetry, and period C is used for calculation of the current field.
The storm began as a coalescing low-pressure system crossing the North Sea with
a W, NW direction, February 20–21. A second low-pressure system passed between
February 22 and 24, and on the 26th, there is the trespassing of an extreme low
front, which causes the most severe effects. The direction of the last two systems is
westerly. The wind speed for the 10-day period of data acquisition was stronger than
8 m/s (75% of the data), and more than 10% of the wind measurements exceed the
20-m/s threshold. The directional wind window is southwest to west, and only less
than 5% is from a different direction, which mainly was from the north. As displayed
in Table 3.2, the 10-min averaged time series are illustrated in Figure 3.7, middle
panel. In all the three periods, the wind conditions were stronger than 7 Beaufort.
During the 10-day experiment, the air pressure exhibited significant variability;
the maximum air pressure was 1015 hPa, and the minimum was 965 hPa (Figure
3.7, upper panel). During data acquisition of period A, the air pressure increased
by approximately 25 hPa, and during period B, it was constant at approximately
TABLE 3.2
Wind Conditions during the Observation Periods
Period A
Period B
Period C
Minimum wind speed (m/s)
11.1
10.3
8.7
Maximum wind speed (m/s)
22.3
16.5
24.7
Mean wind speed (m/s)
17.3
14.2
15.4
Wind direction
NW
SW
W