

46
Multiscale Hydrologic Remote Sensing: Perspectives and Applications
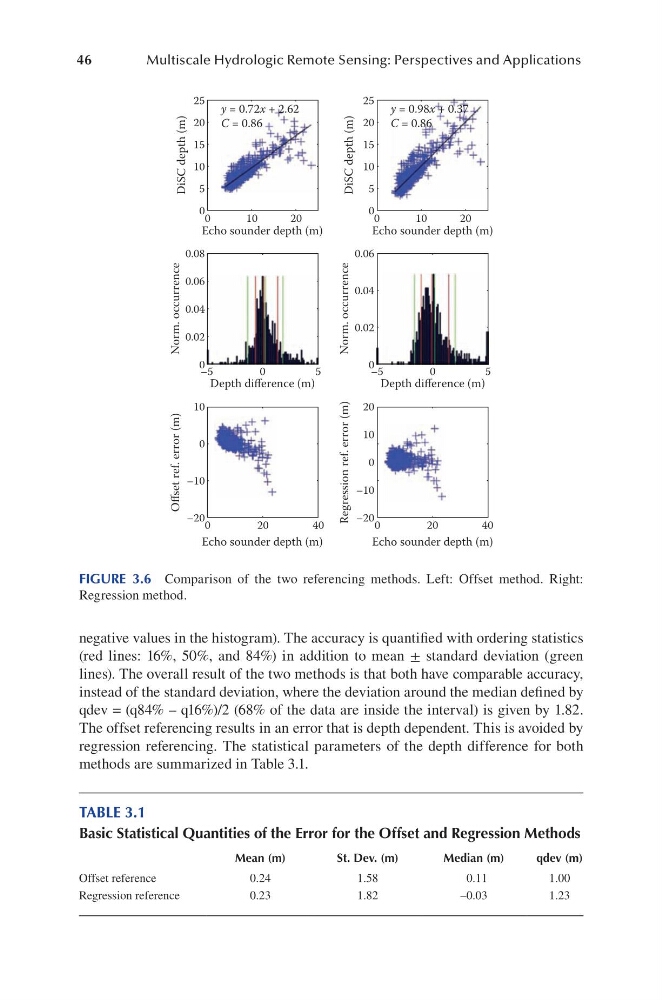
negative values in the histogram). The accuracy is quantified with ordering statistics
(red lines: 16%, 50%, and 84%) in addition to mean ± standard deviation (green
lines). The overall result of the two methods is that both have comparable accuracy,
instead of the standard deviation, where the deviation around the median defined by
qdev = (q84% – q16%)/2 (68% of the data are inside the interval) is given by 1.82.
The offset referencing results in an error that is depth dependent. This is avoided by
regression referencing. The statistical parameters of the depth difference for both
methods are summarized in Table 3.1.
25 y = 0.72x + 2.62
C = 0.86
y = 0.98x + 0.37
C = 0.86
20
15
10
5
0
0
10
DiSC depth (m)
Norm. occurrence
Offset ref. error (m)
Regression ref. error (m)
Norm. occurrence
DiSC depth (m)
Echo sounder depth (m)
–5
0
20
40
40
20
0
5
0
Depth difference (m)
–5
5
0
Depth difference (m)
Echo sounder depth (m)
Echo sounder depth (m)
Echo sounder depth (m)
20
0
10
20
25
0.08
0.06
0.04
0.02
0
10
0
–10
–20
–20
–10
0
10
20
0.06
0.04
0.02
0
20
15
10
5
0
FIGURE 3.6 Comparison of the two referencing methods. Left: Offset method. Right:
Regression method.
TABLE 3.1
Basic Statistical Quantities of the Error for the Offset and Regression Methods
Mean (m)
St. Dev. (m)
Median (m)
qdev (m)
Offset reference
0.24
1.58
0.11
1.00
Regression reference
0.23
1.82
–0.03
1.23
Multiscale Hydrologic Remote Sensing: Perspectives and Applications
negative values in the histogram). The accuracy is quantified with ordering statistics
(red lines: 16%, 50%, and 84%) in addition to mean ± standard deviation (green
lines). The overall result of the two methods is that both have comparable accuracy,
instead of the standard deviation, where the deviation around the median defined by
qdev = (q84% – q16%)/2 (68% of the data are inside the interval) is given by 1.82.
The offset referencing results in an error that is depth dependent. This is avoided by
regression referencing. The statistical parameters of the depth difference for both
methods are summarized in Table 3.1.
25 y = 0.72x + 2.62
C = 0.86
y = 0.98x + 0.37
C = 0.86
20
15
10
5
0
0
10
DiSC depth (m)
Norm. occurrence
Offset ref. error (m)
Regression ref. error (m)
Norm. occurrence
DiSC depth (m)
Echo sounder depth (m)
–5
0
20
40
40
20
0
5
0
Depth difference (m)
–5
5
0
Depth difference (m)
Echo sounder depth (m)
Echo sounder depth (m)
Echo sounder depth (m)
20
0
10
20
25
0.08
0.06
0.04
0.02
0
10
0
–10
–20
–20
–10
0
10
20
0.06
0.04
0.02
0
20
15
10
5
0
FIGURE 3.6 Comparison of the two referencing methods. Left: Offset method. Right:
Regression method.
TABLE 3.1
Basic Statistical Quantities of the Error for the Offset and Regression Methods
Mean (m)
St. Dev. (m)
Median (m)
qdev (m)
Offset reference
0.24
1.58
0.11
1.00
Regression reference
0.23
1.82
–0.03
1.23