

528
Multiscale Hydrologic Remote Sensing: Perspectives and Applications
Test Case 3: Fire on April 29
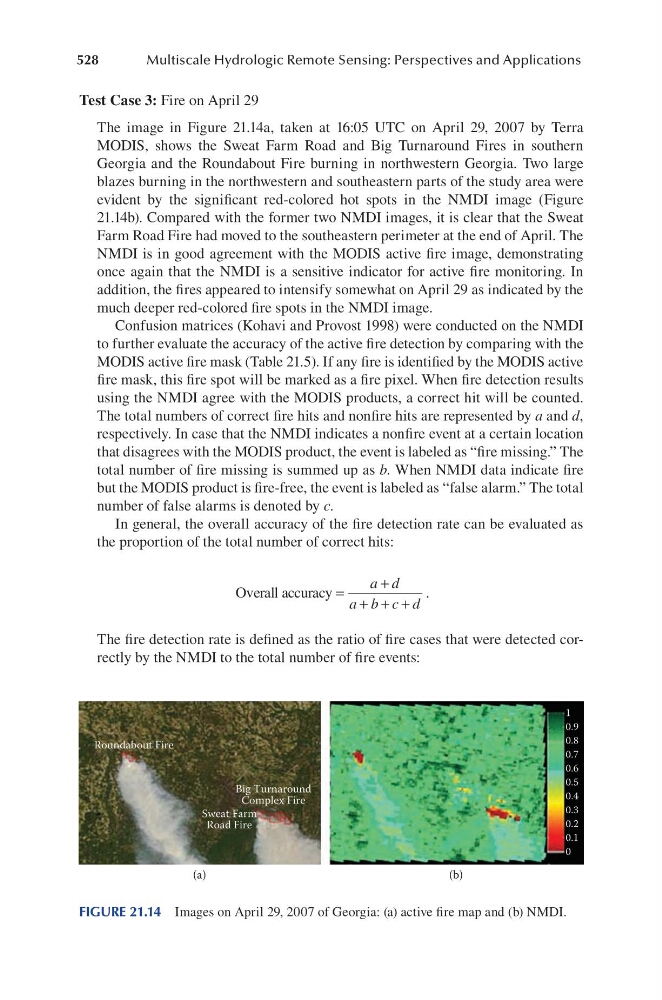
The image in Figure 21.14a, taken at 16:05 UTC on April 29, 2007 by Terra
MODIS, shows the Sweat Farm Road and Big Turnaround Fires in southern
Georgia and the Roundabout Fire burning in northwestern Georgia. Two large
blazes burning in the northwestern and southeastern parts of the study area were
evident by the significant red-colored hot spots in the NMDI image (Figure
21.14b). Compared with the former two NMDI images, it is clear that the Sweat
Farm Road Fire had moved to the southeastern perimeter at the end of April. The
NMDI is in good agreement with the MODIS active fire image, demonstrating
once again that the NMDI is a sensitive indicator for active fire monitoring. In
addition, the fires appeared to intensify somewhat on April 29 as indicated by the
much deeper red-colored fire spots in the NMDI image.
Confusion matrices (Kohavi and Provost 1998) were conducted on the NMDI
to further evaluate the accuracy of the active fire detection by comparing with the
MODIS active fire mask (Table 21.5). If any fire is identified by the MODIS active
fire mask, this fire spot will be marked as a fire pixel. When fire detection results
using the NMDI agree with the MODIS products, a correct hit will be counted.
The total numbers of correct fire hits and nonfire hits are represented by a and d,
respectively. In case that the NMDI indicates a nonfire event at a certain location
that disagrees with the MODIS product, the event is labeled as “fire missing.” The
total number of fire missing is summed up as b. When NMDI data indicate fire
but the MODIS product is fire-free, the event is labeled as “false alarm.” The total
number of false alarms is denoted by c.
In general, the overall accuracy of the fire detection rate can be evaluated as
the proportion of the total number of correct hits:
Overall accuracy =
+
+ + +
a d
a b c d
.
The fire detection rate is defined as the ratio of fire cases that were detected correctly by the NMDI to the total number of fire events:
1
0.9
0.8
0.7
0.6
0.5
0.4
0.3
0.2
0.1
0
Roundabout Fire
Big Turnaround
Complex Fire
Sweat Farm
Road Fire
(a)
(b)
FIGURE 21.14 Images on April 29, 2007 of Georgia: (a) active fire map and (b) NMDI.