

527
Soil and Vegetation Moisture Changes for Forest Fire Events
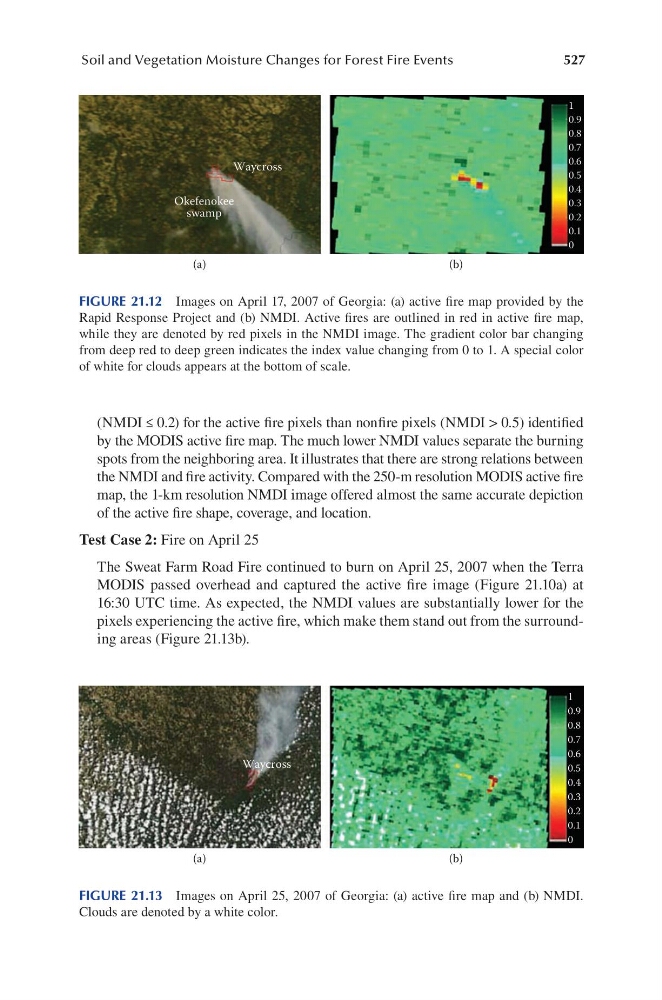
(NMDI ≤ 0.2) for the active fire pixels than nonfire pixels (NMDI > 0.5) identified
by the MODIS active fire map. The much lower NMDI values separate the burning
spots from the neighboring area. It illustrates that there are strong relations between
the NMDI and fire activity. Compared with the 250-m resolution MODIS active fire
map, the 1-km resolution NMDI image offered almost the same accurate depiction
of the active fire shape, coverage, and location.
Test Case 2: Fire on April 25
The Sweat Farm Road Fire continued to burn on April 25, 2007 when the Terra
MODIS passed overhead and captured the active fire image (Figure 21.10a) at
16:30 UTC time. As expected, the NMDI values are substantially lower for the
pixels experiencing the active fire, which make them stand out from the surrounding areas (Figure 21.13b).
Waycross
1
0.9
0.8
0.7
0.6
0.5
0.4
0.3
0.2
0.1
0
Okefenokee
swamp
(a)
(b)
FIGURE 21.12 Images on April 17, 2007 of Georgia: (a) active fire map provided by the
Rapid Response Project and (b) NMDI. Active fires are outlined in red in active fire map,
while they are denoted by red pixels in the NMDI image. The gradient color bar changing
from deep red to deep green indicates the index value changing from 0 to 1. A special color
of white for clouds appears at the bottom of scale.
1
0.9
0.8
0.7
0.6
0.5
0.4
0.3
0.2
0.1
0
Waycross
(a)
(b)
FIGURE 21.13 Images on April 25, 2007 of Georgia: (a) active fire map and (b) NMDI.
Clouds are denoted by a white color.