

526
Multiscale Hydrologic Remote Sensing: Perspectives and Applications
NMDI values for soil is between 0 and 1, with higher values indicating increasing
soil drought, while the typical range is from 0.7 to 0.9 for very dry bare soil, 0.3–0.5
for intermediate moisture conditions, and less than 0.3 for extremely wet soil (Wang
and Qu 2007). The following format of the NMDI is adopted to monitor soil moisture conditions:
NMDI
m
m
m
m
soil =
−
⋅
−
⋅
− ⋅
⋅
+
0 9
86
64
13
86
0
1
2
0
.
(
)
(
R
R
R
R
µ
µ
µ
µ
R R
R
1
2
64
13
⋅
− ⋅
µ
µ
m
m)
.
(21.7)
By applying this modification, NMDI soil can be used to interpret soil moisture status in the same direction as NMDI veg : ranging from 0 to 0.9 with higher values indicating wetter conditions, 0.4–0.6 for moderate wet soil, >0.6 for extremely wet soil,
<0.4 for dry conditions, and <0.2 for extreme severity of soil drought, which may
be induced by burning fires (Table 21.4). Several fires burning in southern Georgia,
USA, and southern Greece in 2007 were selected to test the usefulness of the abovementioned water-related indices for fire detection.
21.5.3 indiceS teSting and diScuSSion of ReSultS
21.5.3.1 Georgia Fires
We selected satellite data of forest fires in southern Georgia obtained on 17, 25, and
29 April, relatively clear days and intense fire periods.
Test Case 1: Fire on April 17
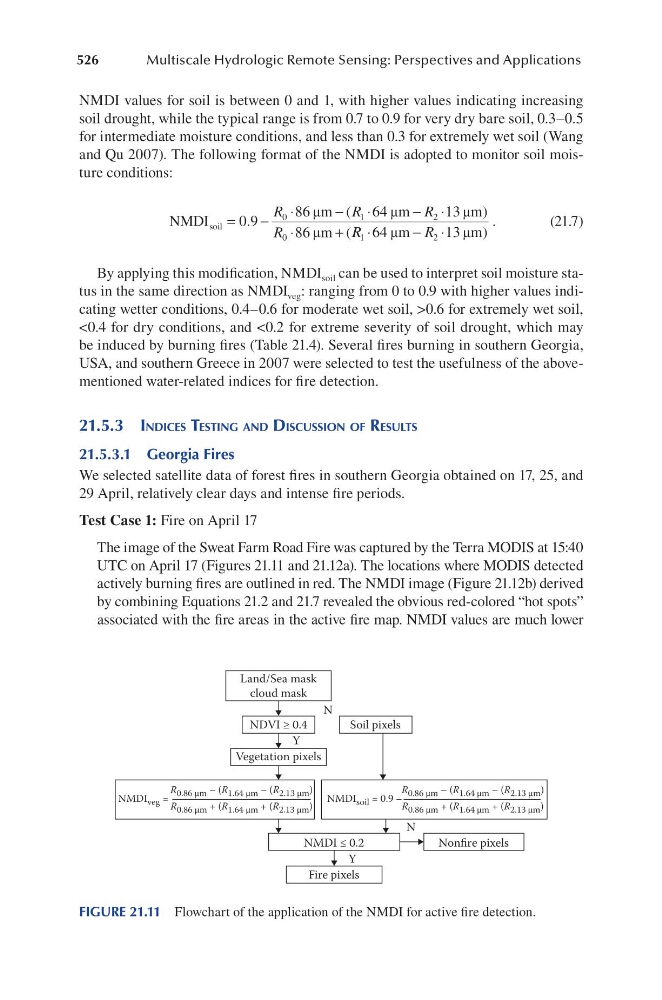
The image of the Sweat Farm Road Fire was captured by the Terra MODIS at 15:40
UTC on April 17 (Figures 21.11 and 21.12a). The locations where MODIS detected
actively burning fires are outlined in red. The NMDI image (Figure 21.12b) derived
by combining Equations 21.2 and 21.7 revealed the obvious red-colored “hot spots”
associated with the fire areas in the active fire map. NMDI values are much lower
Land/Sea mask
cloud mask
NDVI ≥ 0.4
Vegetation pixels
Soil pixels
Fire pixels
NMDI ≤ 0.2
Nonfire pixels
N
N
Y
Y
NMDI veg =
R 0.86 µm – (R 1.64 µm – (R 2.13 µm )
R 0.86 µm + (R 1.64 µm + (R 2.13 µm )
NMDI soil = 0.9 –
R 0.86 µm – (R 1.64 µm – (R 2.13 µm )
R 0.86 µm + (R 1.64 µm + (R 2.13 µm )
FIGURE 21.11 Flowchart of the application of the NMDI for active fire detection.