

521
Soil and Vegetation Moisture Changes for Forest Fire Events
year of 2007. Lower values of the NMDI indicate increasing severity of vegetation
drought. It is obvious that NMDI values are much higher in the wet year (2005) than
in the severe drought year (2007). The NMDI images in year 2007 reveal the redcolored areas associated with the severe drought. Drought development from June to
August can also be detected clearly for both years from NMDI images, represented
by the increased broader areas covered by yellow or red colors in August compared
with that in June. It thus demonstrates the capability of the NMDI for monitoring
vegetation drought: it provides more details in the quantitative estimates and spatial
pattern of droughts than the sparse ground measurements or the lumped meteorological drought indices such as the PDSI.
21.4.2.2 Fire Activities and Drought Conditions
Analyses of forest fire activity have established that the moisture availability can
influence the occurrence and behavior of wildland fires. Fire activity data, including fire number and burned area from 2001 to 2007, have been combined with the
PDSI and NMDI to investigate the connection between fire occurrence and moisture
conditions.
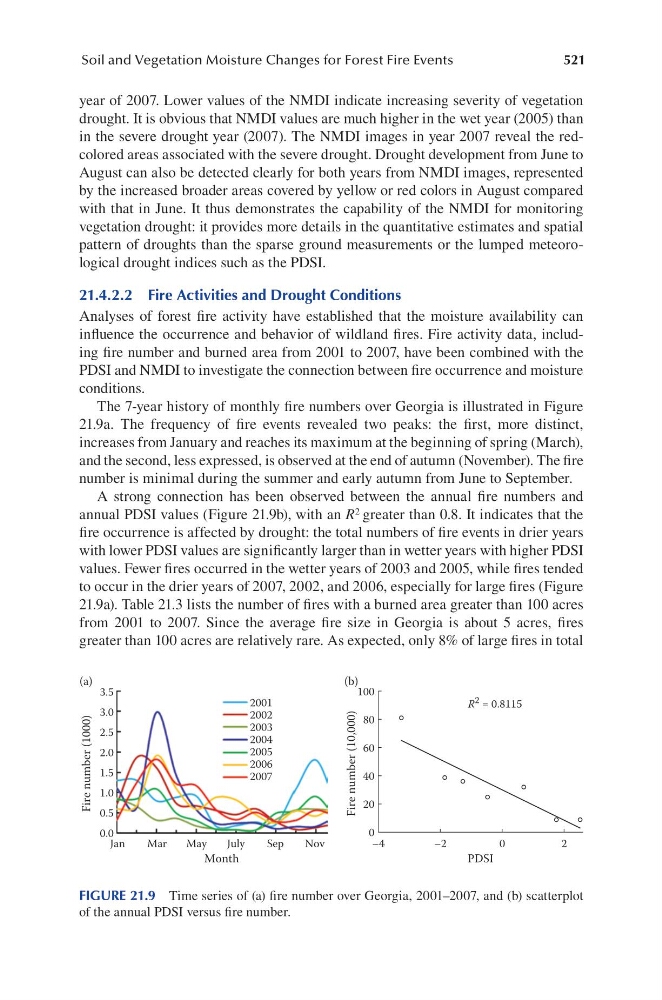
The 7-year history of monthly fire numbers over Georgia is illustrated in Figure
21.9a. The frequency of fire events revealed two peaks: the first, more distinct,
increases from January and reaches its maximum at the beginning of spring (March),
and the second, less expressed, is observed at the end of autumn (November). The fire
number is minimal during the summer and early autumn from June to September.
A strong connection has been observed between the annual fire numbers and
annual PDSI values (Figure 21.9b), with an R 2 greater than 0.8. It indicates that the
fire occurrence is affected by drought: the total numbers of fire events in drier years
with lower PDSI values are significantly larger than in wetter years with higher PDSI
values. Fewer fires occurred in the wetter years of 2003 and 2005, while fires tended
to occur in the drier years of 2007, 2002, and 2006, especially for large fires (Figure
21.9a). Table 21.3 lists the number of fires with a burned area greater than 100 acres
from 2001 to 2007. Since the average fire size in Georgia is about 5 acres, fires
greater than 100 acres are relatively rare. As expected, only 8% of large fires in total
3.5
3.0
2.5
2.0
1.5
1.0
0.5
0
20
40
60
80
100
R 2 = 0.8115
0.0
Jan
Mar
May
July
Month
PDSI
Fire number (1000)
Fire number (10,000)
(a)
(b)
Sep
Nov
2001
2002
2003
2004
2005
2006
2007
–4
–2
0
2
FIGURE 21.9 Time series of (a) fire number over Georgia, 2001–2007, and (b) scatterplot
of the annual PDSI versus fire number.
Soil and Vegetation Moisture Changes for Forest Fire Events
year of 2007. Lower values of the NMDI indicate increasing severity of vegetation
drought. It is obvious that NMDI values are much higher in the wet year (2005) than
in the severe drought year (2007). The NMDI images in year 2007 reveal the redcolored areas associated with the severe drought. Drought development from June to
August can also be detected clearly for both years from NMDI images, represented
by the increased broader areas covered by yellow or red colors in August compared
with that in June. It thus demonstrates the capability of the NMDI for monitoring
vegetation drought: it provides more details in the quantitative estimates and spatial
pattern of droughts than the sparse ground measurements or the lumped meteorological drought indices such as the PDSI.
21.4.2.2 Fire Activities and Drought Conditions
Analyses of forest fire activity have established that the moisture availability can
influence the occurrence and behavior of wildland fires. Fire activity data, including fire number and burned area from 2001 to 2007, have been combined with the
PDSI and NMDI to investigate the connection between fire occurrence and moisture
conditions.
The 7-year history of monthly fire numbers over Georgia is illustrated in Figure
21.9a. The frequency of fire events revealed two peaks: the first, more distinct,
increases from January and reaches its maximum at the beginning of spring (March),
and the second, less expressed, is observed at the end of autumn (November). The fire
number is minimal during the summer and early autumn from June to September.
A strong connection has been observed between the annual fire numbers and
annual PDSI values (Figure 21.9b), with an R 2 greater than 0.8. It indicates that the
fire occurrence is affected by drought: the total numbers of fire events in drier years
with lower PDSI values are significantly larger than in wetter years with higher PDSI
values. Fewer fires occurred in the wetter years of 2003 and 2005, while fires tended
to occur in the drier years of 2007, 2002, and 2006, especially for large fires (Figure
21.9a). Table 21.3 lists the number of fires with a burned area greater than 100 acres
from 2001 to 2007. Since the average fire size in Georgia is about 5 acres, fires
greater than 100 acres are relatively rare. As expected, only 8% of large fires in total
3.5
3.0
2.5
2.0
1.5
1.0
0.5
0
20
40
60
80
100
R 2 = 0.8115
0.0
Jan
Mar
May
July
Month
PDSI
Fire number (1000)
Fire number (10,000)
(a)
(b)
Sep
Nov
2001
2002
2003
2004
2005
2006
2007
–4
–2
0
2
FIGURE 21.9 Time series of (a) fire number over Georgia, 2001–2007, and (b) scatterplot
of the annual PDSI versus fire number.