

522
Multiscale Hydrologic Remote Sensing: Perspectives and Applications
occurred in the wetter years of 2003 and 2005, while approximately 70% occurred
in the drier years of 2007, 2002, and 2006 in a 7-year period. It implies that drought
intensity also influences fire extent and the most widespread fires occur in the driest
years.
Frequency analysis was employed to evaluate the connection between the NMDI
and fire activity. The NMDI range, from the smallest to the largest value (0.35–0.55),
was divided into 10 classes with an interval of 0.02. For each class, the number of the
fire events occurred in the months when NMDI values fall within each designated
category were summed up as the total fire events. The frequency was then defined
as the total fire events divided by the number of months within each NMDI class.
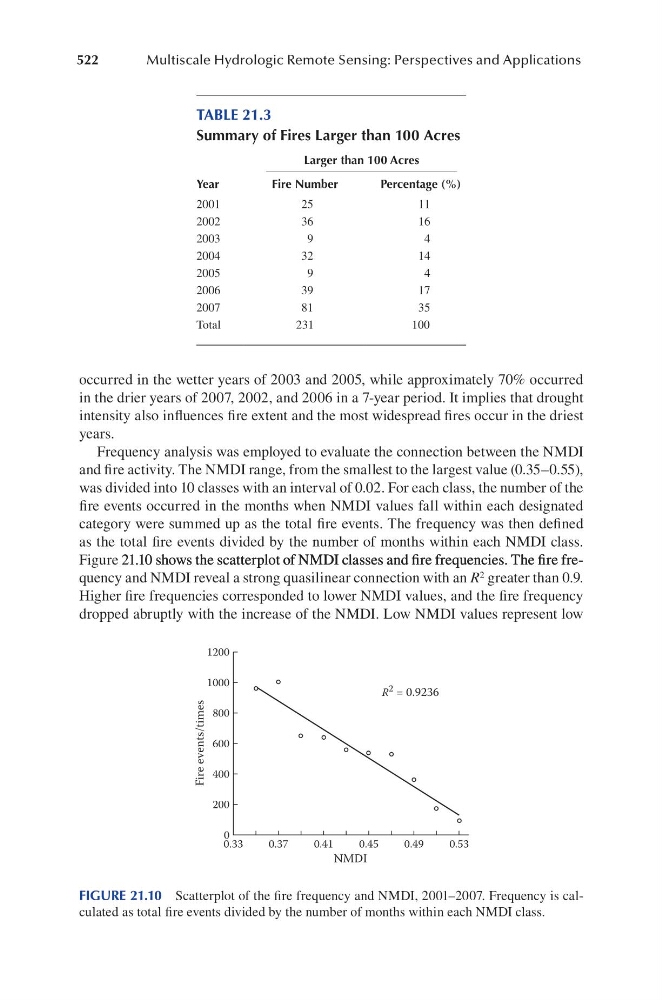
Figure 21.10 shows the scatterplot of NMDI classes and fi re frequencies. The fi re fre21.10 shows the scatterplot of NMDI classes and fi re frequencies. The fi re fre.10 shows the scatterplot of NMDI classes and fire frequencies. The fire frequency and NMDI reveal a strong quasilinear connection with an R 2 greater than 0.9.
Higher fire frequencies corresponded to lower NMDI values, and the fire frequency
dropped abruptly with the increase of the NMDI. Low NMDI values represent low
TABLE 21.3
Summary of Fires Larger than 100 Acres
Year
Larger than 100 Acres
Fire Number
Percentage (%)
2001
25
11
2002
36
16
2003
9
4
2004
32
14
2005
9
4
2006
39
17
2007
81
35
Total
231
100
1200
1000
800
600
400
200
0
0.33
0.37
0.41
0.45
0.49
0.53
NMDI
Fire events/times
R 2 = 0.9236
FIGURE 21.10 Scatterplot of the fire frequency and NMDI, 2001–2007. Frequency is calculated as total fire events divided by the number of months within each NMDI class.
Multiscale Hydrologic Remote Sensing: Perspectives and Applications
occurred in the wetter years of 2003 and 2005, while approximately 70% occurred
in the drier years of 2007, 2002, and 2006 in a 7-year period. It implies that drought
intensity also influences fire extent and the most widespread fires occur in the driest
years.
Frequency analysis was employed to evaluate the connection between the NMDI
and fire activity. The NMDI range, from the smallest to the largest value (0.35–0.55),
was divided into 10 classes with an interval of 0.02. For each class, the number of the
fire events occurred in the months when NMDI values fall within each designated
category were summed up as the total fire events. The frequency was then defined
as the total fire events divided by the number of months within each NMDI class.
Figure 21.10 shows the scatterplot of NMDI classes and fi re frequencies. The fi re fre21.10 shows the scatterplot of NMDI classes and fi re frequencies. The fi re fre.10 shows the scatterplot of NMDI classes and fire frequencies. The fire frequency and NMDI reveal a strong quasilinear connection with an R 2 greater than 0.9.
Higher fire frequencies corresponded to lower NMDI values, and the fire frequency
dropped abruptly with the increase of the NMDI. Low NMDI values represent low
TABLE 21.3
Summary of Fires Larger than 100 Acres
Year
Larger than 100 Acres
Fire Number
Percentage (%)
2001
25
11
2002
36
16
2003
9
4
2004
32
14
2005
9
4
2006
39
17
2007
81
35
Total
231
100
1200
1000
800
600
400
200
0
0.33
0.37
0.41
0.45
0.49
0.53
NMDI
Fire events/times
R 2 = 0.9236
FIGURE 21.10 Scatterplot of the fire frequency and NMDI, 2001–2007. Frequency is calculated as total fire events divided by the number of months within each NMDI class.