

519
Soil and Vegetation Moisture Changes for Forest Fire Events
September, the drought conditions of each year indicated by NMDI, NDWI 2,6 , and
NDWI 2,7 agree well with what have been identified by the PDSI. The values of each
index reach their lowest level in the driest year of 2007 and maintain lower levels in
the dry years of 2002 and 2006 than in the relatively wetter years of 2005 and 2003.
In terms of NDWI 2,5 , however, the highest values appear in 2004, while the relatively
wetter year of 2005 has been sorted to the same group as the drier years of 2002 and
2006. It means that 2004 will be identified as the wettest year and 2005 is the drier
year, like 2002 and 2006, if using NDWI 2,5 as the sole indicator. Obviously, the above
conclusion derived from NDWI 2,5 conflicts with the drought conditions identified by
the PDSI and areas under droughts. Therefore, the following sections will mainly
focus on NMDI, NDWI 2,6 , and NDWI 2,7 , which have consistent results with the PDSI.
With respect to the temporal distribution of each index, both NDWI 2,6 and NDWI 2,7
curves are skewed right with high values from July to August, while the high values
of the NMDI occur approximately 2 months earlier from May to June. LAI, defined as
the leaf area per unit ground surface, is used as an indicator of leaf development stage
in the area, denoted by the dashed black curve in Figure 21.7. The 7-year averaged
LAI increases quasilinearly from March until approaching its maximum a few days
after May, which means the leaves have reached full development. High LAI values
are retained from June to July, until there is an abrupt decreasing trend starting in
August, indicating that leaf senescence occurred. The seasonal variations of moisture
conditions interpreted by the NMDI are consistent with LAI change: higher values in
leaf development stage and a decrease in the period of leaf senescence due to the ripening process, which reduces the vegetation water content in the leaves (Min and Lin
2006). The assessment of seasonal rhythms of vegetation moisture by the NMDI is
more dependable than NDWI 2,6 and NDWI 2,7 : both NDWI 2,6 and NDWI 2,7 have clearly
expressed peaks observed in August, while the LAI experienced a visible drop, caused
by leaf fall. Thus, the NMDI leads to an improvement in representing physical properties of vegetation water content over the index, which uses a single SWIR band 6 or 7.
To further assess the drought monitoring performance of each water index, the
scaled index (Index*) has been employed to examine the index sensitivity corresponding to the wet and dry conditions, which is the ratio of the difference between
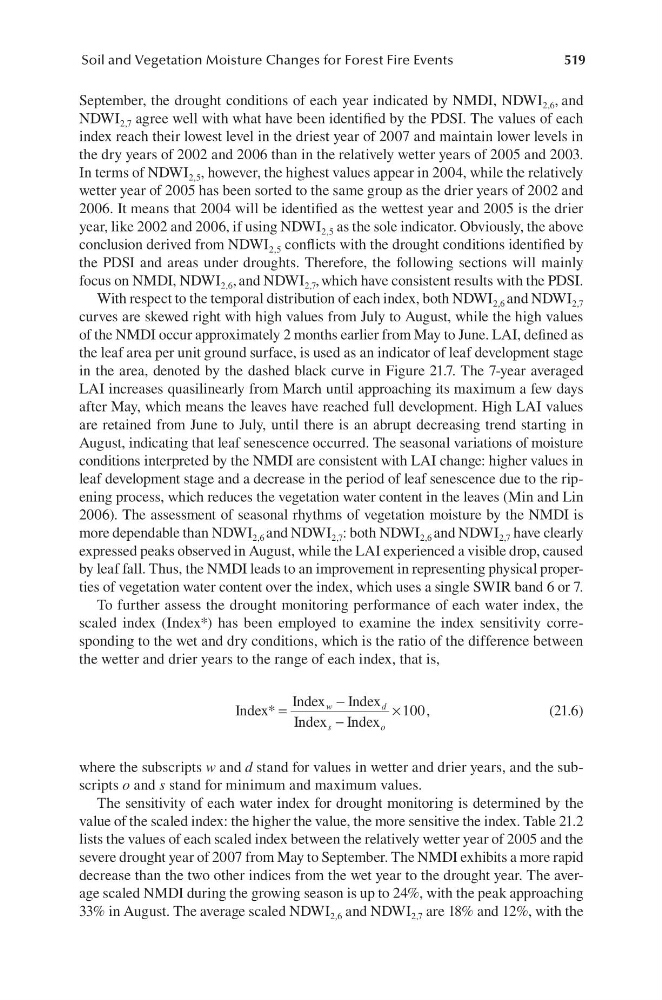
the wetter and drier years to the range of each index, that is,
Index
Index Index
Index Index
* =
−
−
×
w
d
s
o
100 ,
(21.6)
where the subscripts w and d stand for values in wetter and drier years, and the subscripts o and s stand for minimum and maximum values.
The sensitivity of each water index for drought monitoring is determined by the
value of the scaled index: the higher the value, the more sensitive the index. Table 21.2
lists the values of each scaled index between the relatively wetter year of 2005 and the
severe drought year of 2007 from May to September. The NMDI exhibits a more rapid
decrease than the two other indices from the wet year to the drought year. The average scaled NMDI during the growing season is up to 24%, with the peak approaching
33% in August. The average scaled NDWI 2,6 and NDWI 2,7 are 18% and 12%, with the
Soil and Vegetation Moisture Changes for Forest Fire Events
September, the drought conditions of each year indicated by NMDI, NDWI 2,6 , and
NDWI 2,7 agree well with what have been identified by the PDSI. The values of each
index reach their lowest level in the driest year of 2007 and maintain lower levels in
the dry years of 2002 and 2006 than in the relatively wetter years of 2005 and 2003.
In terms of NDWI 2,5 , however, the highest values appear in 2004, while the relatively
wetter year of 2005 has been sorted to the same group as the drier years of 2002 and
2006. It means that 2004 will be identified as the wettest year and 2005 is the drier
year, like 2002 and 2006, if using NDWI 2,5 as the sole indicator. Obviously, the above
conclusion derived from NDWI 2,5 conflicts with the drought conditions identified by
the PDSI and areas under droughts. Therefore, the following sections will mainly
focus on NMDI, NDWI 2,6 , and NDWI 2,7 , which have consistent results with the PDSI.
With respect to the temporal distribution of each index, both NDWI 2,6 and NDWI 2,7
curves are skewed right with high values from July to August, while the high values
of the NMDI occur approximately 2 months earlier from May to June. LAI, defined as
the leaf area per unit ground surface, is used as an indicator of leaf development stage
in the area, denoted by the dashed black curve in Figure 21.7. The 7-year averaged
LAI increases quasilinearly from March until approaching its maximum a few days
after May, which means the leaves have reached full development. High LAI values
are retained from June to July, until there is an abrupt decreasing trend starting in
August, indicating that leaf senescence occurred. The seasonal variations of moisture
conditions interpreted by the NMDI are consistent with LAI change: higher values in
leaf development stage and a decrease in the period of leaf senescence due to the ripening process, which reduces the vegetation water content in the leaves (Min and Lin
2006). The assessment of seasonal rhythms of vegetation moisture by the NMDI is
more dependable than NDWI 2,6 and NDWI 2,7 : both NDWI 2,6 and NDWI 2,7 have clearly
expressed peaks observed in August, while the LAI experienced a visible drop, caused
by leaf fall. Thus, the NMDI leads to an improvement in representing physical properties of vegetation water content over the index, which uses a single SWIR band 6 or 7.
To further assess the drought monitoring performance of each water index, the
scaled index (Index*) has been employed to examine the index sensitivity corresponding to the wet and dry conditions, which is the ratio of the difference between
the wetter and drier years to the range of each index, that is,
Index
Index Index
Index Index
* =
−
−
×
w
d
s
o
100 ,
(21.6)
where the subscripts w and d stand for values in wetter and drier years, and the subscripts o and s stand for minimum and maximum values.
The sensitivity of each water index for drought monitoring is determined by the
value of the scaled index: the higher the value, the more sensitive the index. Table 21.2
lists the values of each scaled index between the relatively wetter year of 2005 and the
severe drought year of 2007 from May to September. The NMDI exhibits a more rapid
decrease than the two other indices from the wet year to the drought year. The average scaled NMDI during the growing season is up to 24%, with the peak approaching
33% in August. The average scaled NDWI 2,6 and NDWI 2,7 are 18% and 12%, with the