

515
Soil and Vegetation Moisture Changes for Forest Fire Events
extremely dry to an intermediate and wet soil water status (Figure 21.4). The NMDI
values are within the range of 0.7–1 when soil moisture is less than 0.1, which means
dry-soil conditions. In other words, if the NMDI is greater than 0.7, we can conclude
that the soil is dry. NMDI values are around 0.6 when soil moisture is about 0.2,
which means intermediate moisture conditions. When the NMDI is less than 0.6, the
soil is under wet conditions.
21.3.2.2 Vegetation Drought Monitoring
We use examples similar to those reported in a study by Gu et al. (2007) to test the
performance of the NMDI for monitoring vegetation drought. These authors analyzed 5-year (2001–2005) sets of MODIS NDVI and NDWI for grassland drought
assessment for the Flint Hills of Kansas and Oklahoma, which centered at 35.25°
latitude and –91.81° longitude. The drought conditions of the study area in 2003 and
2004 have been identified by the United States Drought Monitor as severe and nondrought category droughts, respectively.
Eight granules of MODIS 8-day 500-m surface reflectance data (MOD09A1,
Collection 4) from July to September were used to derive the NMDI. To illustrate
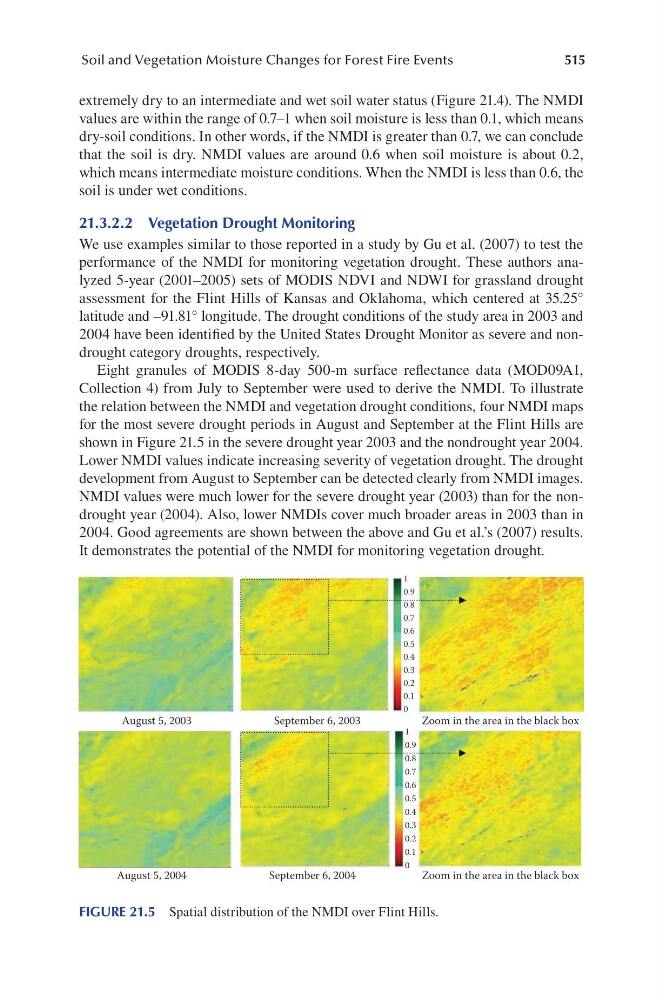
the relation between the NMDI and vegetation drought conditions, four NMDI maps
for the most severe drought periods in August and September at the Flint Hills are
shown in Figure 21.5 in the severe drought year 2003 and the nondrought year 2004.
Lower NMDI values indicate increasing severity of vegetation drought. The drought
development from August to September can be detected clearly from NMDI images.
NMDI values were much lower for the severe drought year (2003) than for the nondrought year (2004). Also, lower NMDIs cover much broader areas in 2003 than in
2004. Good agreements are shown between the above and Gu et al.’s (2007) results.
It demonstrates the potential of the NMDI for monitoring vegetation drought.
August 5, 2003
September 6, 2003
Zoom in the area in the black box
August 5, 2004
September 6, 2004
Zoom in the area in the black box
1
0.9
0.8
0.7
0.6
0.5
0.4
0.3
0.2
0.1
0
1
0.9
0.8
0.7
0.6
0.5
0.4
0.3
0.2
0.1
0
FIGURE 21.5 Spatial distribution of the NMDI over Flint Hills.
Soil and Vegetation Moisture Changes for Forest Fire Events
extremely dry to an intermediate and wet soil water status (Figure 21.4). The NMDI
values are within the range of 0.7–1 when soil moisture is less than 0.1, which means
dry-soil conditions. In other words, if the NMDI is greater than 0.7, we can conclude
that the soil is dry. NMDI values are around 0.6 when soil moisture is about 0.2,
which means intermediate moisture conditions. When the NMDI is less than 0.6, the
soil is under wet conditions.
21.3.2.2 Vegetation Drought Monitoring
We use examples similar to those reported in a study by Gu et al. (2007) to test the
performance of the NMDI for monitoring vegetation drought. These authors analyzed 5-year (2001–2005) sets of MODIS NDVI and NDWI for grassland drought
assessment for the Flint Hills of Kansas and Oklahoma, which centered at 35.25°
latitude and –91.81° longitude. The drought conditions of the study area in 2003 and
2004 have been identified by the United States Drought Monitor as severe and nondrought category droughts, respectively.
Eight granules of MODIS 8-day 500-m surface reflectance data (MOD09A1,
Collection 4) from July to September were used to derive the NMDI. To illustrate
the relation between the NMDI and vegetation drought conditions, four NMDI maps
for the most severe drought periods in August and September at the Flint Hills are
shown in Figure 21.5 in the severe drought year 2003 and the nondrought year 2004.
Lower NMDI values indicate increasing severity of vegetation drought. The drought
development from August to September can be detected clearly from NMDI images.
NMDI values were much lower for the severe drought year (2003) than for the nondrought year (2004). Also, lower NMDIs cover much broader areas in 2003 than in
2004. Good agreements are shown between the above and Gu et al.’s (2007) results.
It demonstrates the potential of the NMDI for monitoring vegetation drought.
August 5, 2003
September 6, 2003
Zoom in the area in the black box
August 5, 2004
September 6, 2004
Zoom in the area in the black box
1
0.9
0.8
0.7
0.6
0.5
0.4
0.3
0.2
0.1
0
1
0.9
0.8
0.7
0.6
0.5
0.4
0.3
0.2
0.1
0
FIGURE 21.5 Spatial distribution of the NMDI over Flint Hills.