

514
Multiscale Hydrologic Remote Sensing: Perspectives and Applications
Miller et al. 2004). In the absence of suitable field data, the usefulness of NMDI for
remotely sensing soil moisture was demonstrate by using the bare soil spectra under
various soil water contents reported in previous studies by Leblon (2000) and Bach
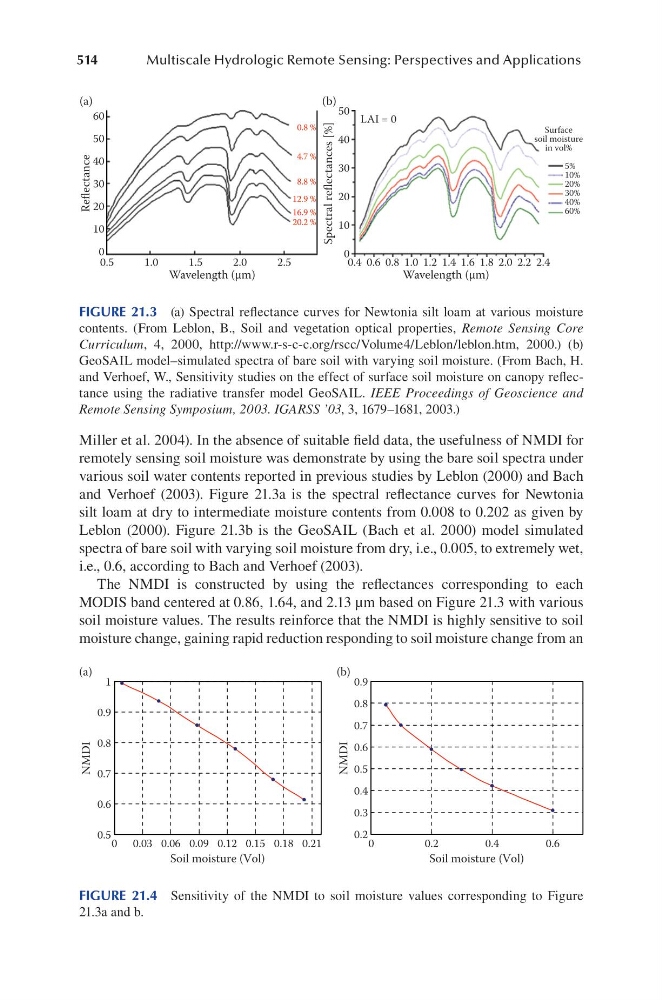
and Verhoef (2003). Figure 21.3a is the spectral reflectance curves for Newtonia
silt loam at dry to intermediate moisture contents from 0.008 to 0.202 as given by
Leblon (2000). Figure 21.3b is the GeoSAIL (Bach et al. 2000) model simulated
spectra of bare soil with varying soil moisture from dry, i.e., 0.005, to extremely wet,
i.e., 0.6, according to Bach and Verhoef (2003).
The NMDI is constructed by using the reflectances corresponding to each
MODIS band centered at 0.86, 1.64, and 2.13 µm based on Figure 21.3 with various
soil moisture values. The results reinforce that the NMDI is highly sensitive to soil
moisture change, gaining rapid reduction responding to soil moisture change from an
60
50
40
30
20
10
0
50
40
LAI = 0
30
20
10
0
0.5
1.0
1.5
2.0
2.5
0.4 0.6 0.8 1.0 1.2 1.4 1.6 1.8 2.0 2.2 2.4
5%
10%
20%
30%
40%
60%
Surface
soil moisture
in vol%
Wavelength (µm)
Reflectance
Spectral reflectances [%]
Wavelength (µm)
(b)
(a)
0.8 %
4.7 %
8.8 %
12.9 %
20.2 %
16.9 %
FIGURE 21.3 (a) Spectral reflectance curves for Newtonia silt loam at various moisture
contents. (From Leblon, B., Soil and vegetation optical properties, Remote Sensing Core
Curriculum, 4, 2000, http://www.r-s-c-c.org/rscc/Volume4/Leblon/leblon.htm, 2000.) (b)
GeoSAIL model–simulated spectra of bare soil with varying soil moisture. (From Bach, H.
and Verhoef, W., Sensitivity studies on the effect of surface soil moisture on canopy reflectance using the radiative transfer model GeoSAIL. IEEE Proceedings of Geoscience and
Remote Sensing Symposium, 2003. IGARSS ’03, 3, 1679–1681, 2003.)
0.2
0.3
0.4
0.5
0.6
0.7
0.8
0.9
NMDI
NMDI
Soil moisture (Vol)
(a)
Soil moisture (Vol)
(b)
0.5
0.6
0.7
0.8
0.9
1
0 0.03 0.06 0.09 0.12 0.15 0.18 0.21
0
0.2
0.4
0.6
FIGURE 21.4 Sensitivity of the NMDI to soil moisture values corresponding to Figure
21.3a and b.
Multiscale Hydrologic Remote Sensing: Perspectives and Applications
Miller et al. 2004). In the absence of suitable field data, the usefulness of NMDI for
remotely sensing soil moisture was demonstrate by using the bare soil spectra under
various soil water contents reported in previous studies by Leblon (2000) and Bach
and Verhoef (2003). Figure 21.3a is the spectral reflectance curves for Newtonia
silt loam at dry to intermediate moisture contents from 0.008 to 0.202 as given by
Leblon (2000). Figure 21.3b is the GeoSAIL (Bach et al. 2000) model simulated
spectra of bare soil with varying soil moisture from dry, i.e., 0.005, to extremely wet,
i.e., 0.6, according to Bach and Verhoef (2003).
The NMDI is constructed by using the reflectances corresponding to each
MODIS band centered at 0.86, 1.64, and 2.13 µm based on Figure 21.3 with various
soil moisture values. The results reinforce that the NMDI is highly sensitive to soil
moisture change, gaining rapid reduction responding to soil moisture change from an
60
50
40
30
20
10
0
50
40
LAI = 0
30
20
10
0
0.5
1.0
1.5
2.0
2.5
0.4 0.6 0.8 1.0 1.2 1.4 1.6 1.8 2.0 2.2 2.4
5%
10%
20%
30%
40%
60%
Surface
soil moisture
in vol%
Wavelength (µm)
Reflectance
Spectral reflectances [%]
Wavelength (µm)
(b)
(a)
0.8 %
4.7 %
8.8 %
12.9 %
20.2 %
16.9 %
FIGURE 21.3 (a) Spectral reflectance curves for Newtonia silt loam at various moisture
contents. (From Leblon, B., Soil and vegetation optical properties, Remote Sensing Core
Curriculum, 4, 2000, http://www.r-s-c-c.org/rscc/Volume4/Leblon/leblon.htm, 2000.) (b)
GeoSAIL model–simulated spectra of bare soil with varying soil moisture. (From Bach, H.
and Verhoef, W., Sensitivity studies on the effect of surface soil moisture on canopy reflectance using the radiative transfer model GeoSAIL. IEEE Proceedings of Geoscience and
Remote Sensing Symposium, 2003. IGARSS ’03, 3, 1679–1681, 2003.)
0.2
0.3
0.4
0.5
0.6
0.7
0.8
0.9
NMDI
NMDI
Soil moisture (Vol)
(a)
Soil moisture (Vol)
(b)
0.5
0.6
0.7
0.8
0.9
1
0 0.03 0.06 0.09 0.12 0.15 0.18 0.21
0
0.2
0.4
0.6
FIGURE 21.4 Sensitivity of the NMDI to soil moisture values corresponding to Figure
21.3a and b.