

516
Multiscale Hydrologic Remote Sensing: Perspectives and Applications
21.4 APPLICATION OF THE NMDI FOR DROUGHT MONITORING
For reliable and operational use of remotely sensing data in drought monitoring, it is
necessary to compare with ground measurements or traditionally used meteorological drought indices so as to establish how well the remotely derived vegetation water
indices reflect wet and dry conditions. This work intended to evaluate the ability of
different satellite-derived indices for measuring and monitoring drought conditions
by comparing with the meteorological data and to investigate the relation between
drought and wildfire occurrence using the state of Georgia in the United States as an
example (Wang et al. 2009).
21.4.1 Methodology
21.4.1.1 Study Area and Data
The study was conducted over Georgia bounded by 30–35°N latitudes and 81–85°W
longitudes. Located in the southeastern United States, Georgia is frequently hit by
recurring droughts and wildfires. The natural vegetation and cropland, mixed forest, woody savannas, and evergreen broadleaf forest occupy a great part of the land
areas.
The major datasets used in this work included a 7-year history of monthly
PDSI, percentage area under droughts, fire number and burned area, and MODIS/
Terra 8-day surface reflectance, 8-day LAI, as well as 1-km Land Cover Type over
Georgia, USA. Drought conditions were characterized by using the monthly PDSI
and percentage areas under droughts. The drought severity categories were identified
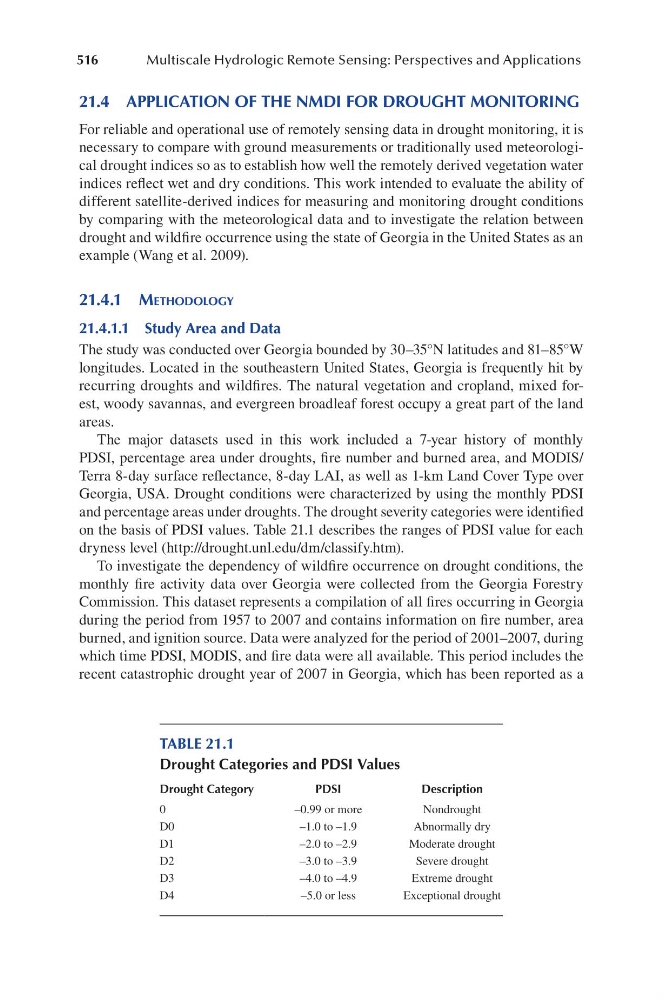
on the basis of PDSI values. Table 21.1 describes the ranges of PDSI value for each
dryness level (http://drought.unl.edu/dm/classify.htm).
To investigate the dependency of wildfire occurrence on drought conditions, the
monthly fire activity data over Georgia were collected from the Georgia Forestry
Commission. This dataset represents a compilation of all fires occurring in Georgia
during the period from 1957 to 2007 and contains information on fire number, area
burned, and ignition source. Data were analyzed for the period of 2001–2007, during
which time PDSI, MODIS, and fire data were all available. This period includes the
recent catastrophic drought year of 2007 in Georgia, which has been reported as a
TABLE 21.1
Drought Categories and PDSI Values
Drought Category
PDSI
Description
0
–0.99 or more
Nondrought
D0
–1.0 to –1.9
Abnormally dry
D1
–2.0 to –2.9
Moderate drought
D2
–3.0 to –3.9
Severe drought
D3
–4.0 to –4.9
Extreme drought
D4
–5.0 or less
Exceptional drought
Multiscale Hydrologic Remote Sensing: Perspectives and Applications
21.4 APPLICATION OF THE NMDI FOR DROUGHT MONITORING
For reliable and operational use of remotely sensing data in drought monitoring, it is
necessary to compare with ground measurements or traditionally used meteorological drought indices so as to establish how well the remotely derived vegetation water
indices reflect wet and dry conditions. This work intended to evaluate the ability of
different satellite-derived indices for measuring and monitoring drought conditions
by comparing with the meteorological data and to investigate the relation between
drought and wildfire occurrence using the state of Georgia in the United States as an
example (Wang et al. 2009).
21.4.1 Methodology
21.4.1.1 Study Area and Data
The study was conducted over Georgia bounded by 30–35°N latitudes and 81–85°W
longitudes. Located in the southeastern United States, Georgia is frequently hit by
recurring droughts and wildfires. The natural vegetation and cropland, mixed forest, woody savannas, and evergreen broadleaf forest occupy a great part of the land
areas.
The major datasets used in this work included a 7-year history of monthly
PDSI, percentage area under droughts, fire number and burned area, and MODIS/
Terra 8-day surface reflectance, 8-day LAI, as well as 1-km Land Cover Type over
Georgia, USA. Drought conditions were characterized by using the monthly PDSI
and percentage areas under droughts. The drought severity categories were identified
on the basis of PDSI values. Table 21.1 describes the ranges of PDSI value for each
dryness level (http://drought.unl.edu/dm/classify.htm).
To investigate the dependency of wildfire occurrence on drought conditions, the
monthly fire activity data over Georgia were collected from the Georgia Forestry
Commission. This dataset represents a compilation of all fires occurring in Georgia
during the period from 1957 to 2007 and contains information on fire number, area
burned, and ignition source. Data were analyzed for the period of 2001–2007, during
which time PDSI, MODIS, and fire data were all available. This period includes the
recent catastrophic drought year of 2007 in Georgia, which has been reported as a
TABLE 21.1
Drought Categories and PDSI Values
Drought Category
PDSI
Description
0
–0.99 or more
Nondrought
D0
–1.0 to –1.9
Abnormally dry
D1
–2.0 to –2.9
Moderate drought
D2
–3.0 to –3.9
Severe drought
D3
–4.0 to –4.9
Extreme drought
D4
–5.0 or less
Exceptional drought