

470
Multiscale Hydrologic Remote Sensing: Perspectives and Applications
and transpiration from the dry surface; and (6) dividing soil surface into saturated
wet surface and moisture surface, and thus, soil evaporation includes potential evaporation from the saturated wet surface and actual evaporation from the moisture
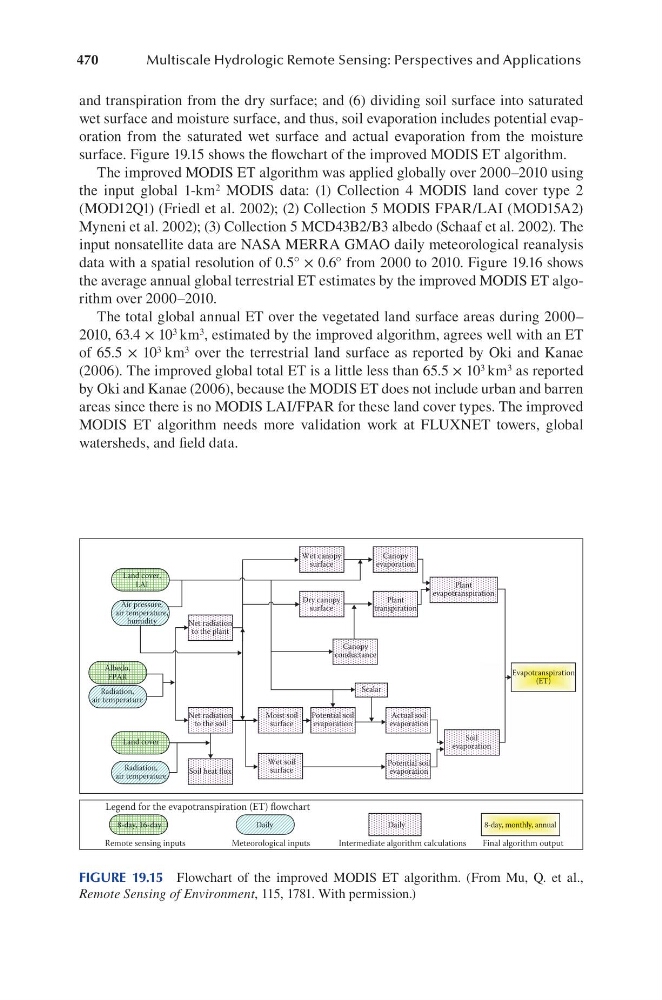
surface. Figure 19.15 shows the flowchart of the improved MODIS ET algorithm.
The improved MODIS ET algorithm was applied globally over 2000–2010 using
the input global 1-km 2 MODIS data: (1) Collection 4 MODIS land cover type 2
(MOD12Q1) (Friedl et al. 2002); (2) Collection 5 MODIS FPAR/LAI (MOD15A2)
Myneni et al. 2002); (3) Collection 5 MCD43B2/B3 albedo (Schaaf et al. 2002). The
input nonsatellite data are NASA MERRA GMAO daily meteorological reanalysis
data with a spatial resolution of 0.5° × 0.6° from 2000 to 2010. Figure 19.16 shows
the average annual global terrestrial ET estimates by the improved MODIS ET algorithm over 2000–2010.
The total global annual ET over the vegetated land surface areas during 2000–
2010, 63.4 × 10 3 km 3 , estimated by the improved algorithm, agrees well with an ET
of 65.5 × 10 3 km 3 over the terrestrial land surface as reported by Oki and Kanae
(2006). The improved global total ET is a little less than 65.5 × 10 3 km 3 as reported
by Oki and Kanae (2006), because the MODIS ET does not include urban and barren
areas since there is no MODIS LAI/FPAR for these land cover types. The improved
MODIS ET algorithm needs more validation work at FLUXNET towers, global
watersheds, and field data.
Land cover,
LAI
Albedo,
FPAR
Land cover
Radiation,
air temperature
Radiation,
air temperature
Air pressure,
air temperature,
humidity
Net radiation
to the plant
Net radiation
to the soil
Soil heat flux
Wet soil
surface
Moist soil
surface
Potential soil
evaporation
Scalar
Canopy
conductance
Dry canopy
surface
Wet canopy
surface
Canopy
evaporation
Plant
transpiration
Plant
evapotranspiration
Evapotranspiration
(ET)
Soil
evaporation
Actual soil
evaporation
Potential soil
evaporation
Daily
Daily
8-day, monthly, annual
8-day, 16-day
Remote sensing inputs
Meteorological inputs
Intermediate algorithm calculations
Final algorithm output
Legend for the evapotranspiration (ET) flowchart
FIGURE 19.15 Flowchart of the improved MODIS ET algorithm. (From Mu, Q. et al.,
Remote Sensing of Environment, 115, 1781. With permission.)
Multiscale Hydrologic Remote Sensing: Perspectives and Applications
and transpiration from the dry surface; and (6) dividing soil surface into saturated
wet surface and moisture surface, and thus, soil evaporation includes potential evaporation from the saturated wet surface and actual evaporation from the moisture
surface. Figure 19.15 shows the flowchart of the improved MODIS ET algorithm.
The improved MODIS ET algorithm was applied globally over 2000–2010 using
the input global 1-km 2 MODIS data: (1) Collection 4 MODIS land cover type 2
(MOD12Q1) (Friedl et al. 2002); (2) Collection 5 MODIS FPAR/LAI (MOD15A2)
Myneni et al. 2002); (3) Collection 5 MCD43B2/B3 albedo (Schaaf et al. 2002). The
input nonsatellite data are NASA MERRA GMAO daily meteorological reanalysis
data with a spatial resolution of 0.5° × 0.6° from 2000 to 2010. Figure 19.16 shows
the average annual global terrestrial ET estimates by the improved MODIS ET algorithm over 2000–2010.
The total global annual ET over the vegetated land surface areas during 2000–
2010, 63.4 × 10 3 km 3 , estimated by the improved algorithm, agrees well with an ET
of 65.5 × 10 3 km 3 over the terrestrial land surface as reported by Oki and Kanae
(2006). The improved global total ET is a little less than 65.5 × 10 3 km 3 as reported
by Oki and Kanae (2006), because the MODIS ET does not include urban and barren
areas since there is no MODIS LAI/FPAR for these land cover types. The improved
MODIS ET algorithm needs more validation work at FLUXNET towers, global
watersheds, and field data.
Land cover,
LAI
Albedo,
FPAR
Land cover
Radiation,
air temperature
Radiation,
air temperature
Air pressure,
air temperature,
humidity
Net radiation
to the plant
Net radiation
to the soil
Soil heat flux
Wet soil
surface
Moist soil
surface
Potential soil
evaporation
Scalar
Canopy
conductance
Dry canopy
surface
Wet canopy
surface
Canopy
evaporation
Plant
transpiration
Plant
evapotranspiration
Evapotranspiration
(ET)
Soil
evaporation
Actual soil
evaporation
Potential soil
evaporation
Daily
Daily
8-day, monthly, annual
8-day, 16-day
Remote sensing inputs
Meteorological inputs
Intermediate algorithm calculations
Final algorithm output
Legend for the evapotranspiration (ET) flowchart
FIGURE 19.15 Flowchart of the improved MODIS ET algorithm. (From Mu, Q. et al.,
Remote Sensing of Environment, 115, 1781. With permission.)