

432
Multiscale Hydrologic Remote Sensing: Perspectives and Applications
associated with differences in the contribution of the woody part of the vegetation
properties in the observations.
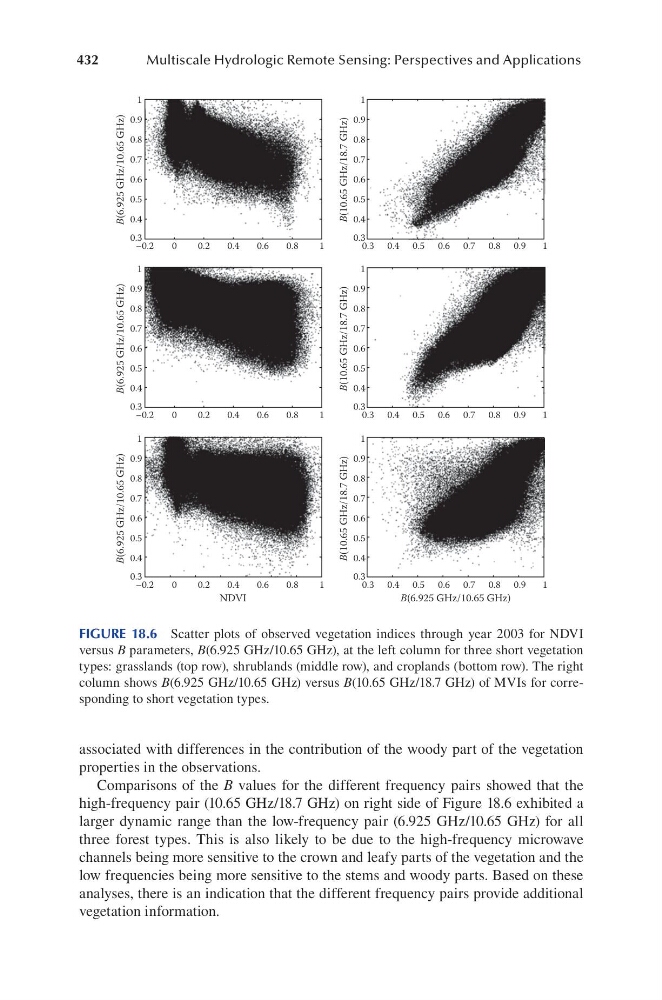
Comparisons of the B values for the different frequency pairs showed that the
high-frequency pair (10.65 GHz/18.7 GHz) on right side of Figure 18.6 exhibited a
larger dynamic range than the low-frequency pair (6.925 GHz/10.65 GHz) for all
three forest types. This is also likely to be due to the high-frequency microwave
channels being more sensitive to the crown and leafy parts of the vegetation and the
low frequencies being more sensitive to the stems and woody parts. Based on these
analyses, there is an indication that the different frequency pairs provide additional
vegetation information.
1
0.9
0.8
0.7
0.6
0.5
0.4
0.3
–0.2
0.2
0.4
0.6
0.8
1
0
B(6.925 GHz/10.65 GHz)
1
0.9
0.8
0.7
0.6
0.5
0.4
0.3
0.3
0.5 0.6 0.7 0.8 0.9
1
0.4
B(10.65 GHz/18.7 GHz)
1
0.9
0.8
0.7
0.6
0.5
0.4
0.3
–0.2
0.2
0.4
0.6
0.8
1
0
B(6.925 GHz/10.65 GHz)
1
0.9
0.8
0.7
0.6
0.5
0.4
0.3
0.3
0.5 0.6 0.7 0.8 0.9
1
0.4
B(10.65 GHz/18.7 GHz)
1
0.9
0.8
0.7
0.6
0.5
0.4
0.3
–0.2
0.2
0.4
0.6
0.8
1
0
B(6.925 GHz/10.65 GHz)
1
0.9
0.8
0.7
0.6
0.5
0.4
0.3
0.3
0.5 0.6 0.7 0.8 0.9
1
0.4
B(10.65 GHz/18.7 GHz)
B(6.925 GHz/10.65 GHz)
NDVI
FIGURE 18.6 Scatter plots of observed vegetation indices through year 2003 for NDVI
versus B parameters, B(6.925 GHz/10.65 GHz), at the left column for three short vegetation
types: grasslands (top row), shrublands (middle row), and croplands (bottom row). The right
column shows B(6.925 GHz/10.65 GHz) versus B(10.65 GHz/18.7 GHz) of MVIs for corresponding to short vegetation types.
Multiscale Hydrologic Remote Sensing: Perspectives and Applications
associated with differences in the contribution of the woody part of the vegetation
properties in the observations.
Comparisons of the B values for the different frequency pairs showed that the
high-frequency pair (10.65 GHz/18.7 GHz) on right side of Figure 18.6 exhibited a
larger dynamic range than the low-frequency pair (6.925 GHz/10.65 GHz) for all
three forest types. This is also likely to be due to the high-frequency microwave
channels being more sensitive to the crown and leafy parts of the vegetation and the
low frequencies being more sensitive to the stems and woody parts. Based on these
analyses, there is an indication that the different frequency pairs provide additional
vegetation information.
1
0.9
0.8
0.7
0.6
0.5
0.4
0.3
–0.2
0.2
0.4
0.6
0.8
1
0
B(6.925 GHz/10.65 GHz)
1
0.9
0.8
0.7
0.6
0.5
0.4
0.3
0.3
0.5 0.6 0.7 0.8 0.9
1
0.4
B(10.65 GHz/18.7 GHz)
1
0.9
0.8
0.7
0.6
0.5
0.4
0.3
–0.2
0.2
0.4
0.6
0.8
1
0
B(6.925 GHz/10.65 GHz)
1
0.9
0.8
0.7
0.6
0.5
0.4
0.3
0.3
0.5 0.6 0.7 0.8 0.9
1
0.4
B(10.65 GHz/18.7 GHz)
1
0.9
0.8
0.7
0.6
0.5
0.4
0.3
–0.2
0.2
0.4
0.6
0.8
1
0
B(6.925 GHz/10.65 GHz)
1
0.9
0.8
0.7
0.6
0.5
0.4
0.3
0.3
0.5 0.6 0.7 0.8 0.9
1
0.4
B(10.65 GHz/18.7 GHz)
B(6.925 GHz/10.65 GHz)
NDVI
FIGURE 18.6 Scatter plots of observed vegetation indices through year 2003 for NDVI
versus B parameters, B(6.925 GHz/10.65 GHz), at the left column for three short vegetation
types: grasslands (top row), shrublands (middle row), and croplands (bottom row). The right
column shows B(6.925 GHz/10.65 GHz) versus B(10.65 GHz/18.7 GHz) of MVIs for corresponding to short vegetation types.