

431
Microwave Vegetation Indices from Satellite Passive Microwave Sensors
North America, where there is significant RFI in the 6.925-GHz measurements (Li
et al. 2004; Njoku et al. 2005). This would introduce large uncertainties and make
the MVIs derived from the low-frequency pair unreliable.
Figure 18.6 (left) shows the scatter plots of NDVI and the low-frequency-pair B
values for the global observations obtained during 2003. These global data sets are
for three forest types: deciduous needleleaf forest (top), representing the forest class
with the highest correlation (0.87 and 0.83) with NDVI measurements; mixed forest
(middle), representing the forest class with the moderate correlation (0.52 and 0.51);
and evergreen broadleaf forest (bottom), representing the forest class with very low
correlation (–0.04 and –0.08). It can be seen that, for any given NDVI observation
(a given value on the x-axis), the observed B value (y-axis) for the same location can
have a large dynamic range. This range reflects the differences in the optical and
microwave sensitivities to the different vegetation properties. It is mainly due to
the intrinsic differences between what microwave and optical sensors observe and
their sensitivities to different parts of vegetation properties. While NDVI represents
the information on a thin layer of the canopy (leaves, the living green material), the
microwave sensor measures the contributions from a thicker layer that includes both
the leafy and woody parts of the vegetation. Therefore, for a specific NDVI value,
the MVI might exhibit a range of values that reflect the differences in the vegetation’s fraction cover, structure, sizes, and water content or wet biomass. These are
(a)
(b)
–1
–0.8
–0.6
–0.4
–0.2
0
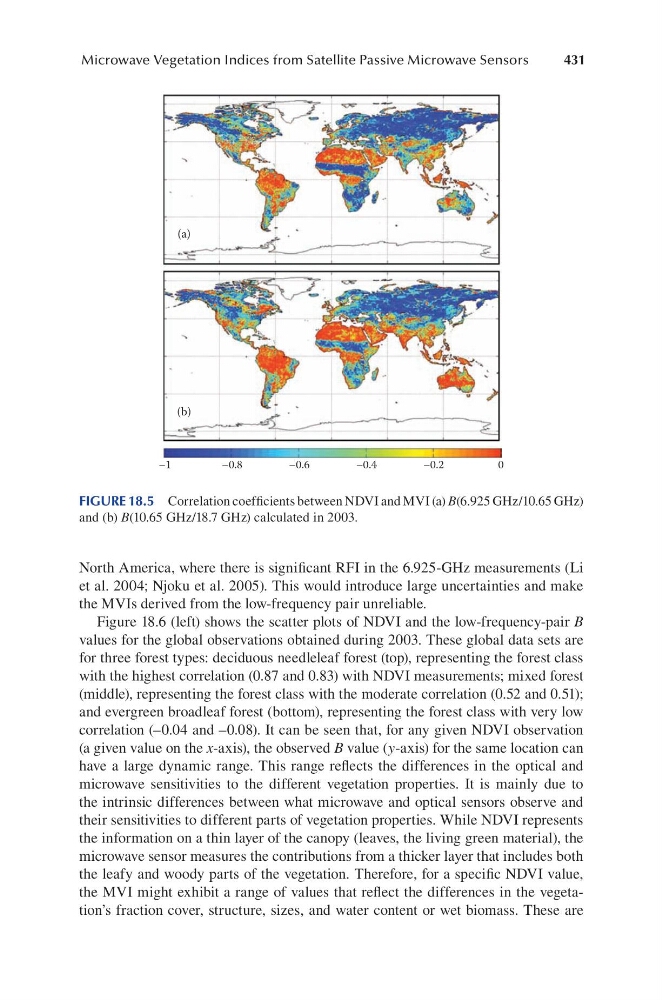
FIGURE 18.5 Correlation coefficients between NDVI and MVI (a) B(6.925 GHz/10.65 GHz)
and (b) B(10.65 GHz/18.7 GHz) calculated in 2003.
Microwave Vegetation Indices from Satellite Passive Microwave Sensors
North America, where there is significant RFI in the 6.925-GHz measurements (Li
et al. 2004; Njoku et al. 2005). This would introduce large uncertainties and make
the MVIs derived from the low-frequency pair unreliable.
Figure 18.6 (left) shows the scatter plots of NDVI and the low-frequency-pair B
values for the global observations obtained during 2003. These global data sets are
for three forest types: deciduous needleleaf forest (top), representing the forest class
with the highest correlation (0.87 and 0.83) with NDVI measurements; mixed forest
(middle), representing the forest class with the moderate correlation (0.52 and 0.51);
and evergreen broadleaf forest (bottom), representing the forest class with very low
correlation (–0.04 and –0.08). It can be seen that, for any given NDVI observation
(a given value on the x-axis), the observed B value (y-axis) for the same location can
have a large dynamic range. This range reflects the differences in the optical and
microwave sensitivities to the different vegetation properties. It is mainly due to
the intrinsic differences between what microwave and optical sensors observe and
their sensitivities to different parts of vegetation properties. While NDVI represents
the information on a thin layer of the canopy (leaves, the living green material), the
microwave sensor measures the contributions from a thicker layer that includes both
the leafy and woody parts of the vegetation. Therefore, for a specific NDVI value,
the MVI might exhibit a range of values that reflect the differences in the vegetation’s fraction cover, structure, sizes, and water content or wet biomass. These are
(a)
(b)
–1
–0.8
–0.6
–0.4
–0.2
0
FIGURE 18.5 Correlation coefficients between NDVI and MVI (a) B(6.925 GHz/10.65 GHz)
and (b) B(10.65 GHz/18.7 GHz) calculated in 2003.