

430
Multiscale Hydrologic Remote Sensing: Perspectives and Applications
NDVI and the MVIs for different vegetation types/land covers, (2) scatter plot analysis of NDVI versus the MVIs, and (3) selected samples of data to evaluate what
complementary vegetation information is provided by the MVIs.
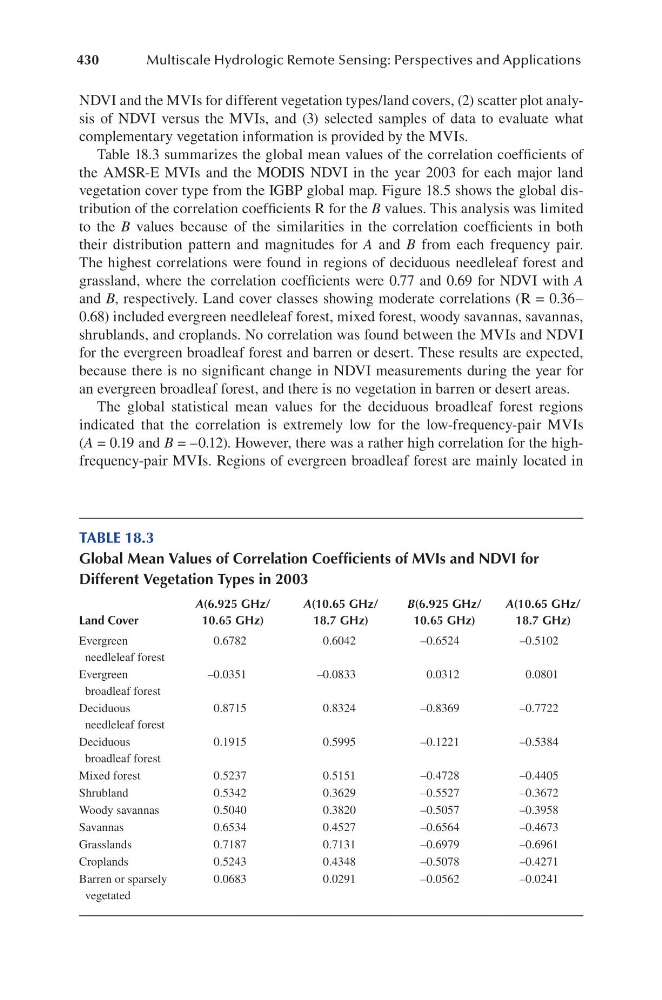
Table 18.3 summarizes the global mean values of the correlation coefficients of
the AMSR-E MVIs and the MODIS NDVI in the year 2003 for each major land
vegetation cover type from the IGBP global map. Figure 18.5 shows the global distribution of the correlation coefficients R for the B values. This analysis was limited
to the B values because of the similarities in the correlation coefficients in both
their distribution pattern and magnitudes for A and B from each frequency pair.
The highest correlations were found in regions of deciduous needleleaf forest and
grassland, where the correlation coefficients were 0.77 and 0.69 for NDVI with A
and B, respectively. Land cover classes showing moderate correlations (R = 0.36–
0.68) included evergreen needleleaf forest, mixed forest, woody savannas, savannas,
shrublands, and croplands. No correlation was found between the MVIs and NDVI
for the evergreen broadleaf forest and barren or desert. These results are expected,
because there is no significant change in NDVI measurements during the year for
an evergreen broadleaf forest, and there is no vegetation in barren or desert areas.
The global statistical mean values for the deciduous broadleaf forest regions
indicated that the correlation is extremely low for the low-frequency-pair MVIs
(A = 0.19 and B = –0.12). However, there was a rather high correlation for the highfrequency-pair MVIs. Regions of evergreen broadleaf forest are mainly located in
TABLE 18.3
Global Mean Values of Correlation Coefficients of MVIs and NDVI for
Different Vegetation Types in 2003
Land Cover
a(6.925 GHz/
10.65 GHz)
a(10.65 GHz/
18.7 GHz)
B(6.925 GHz/
10.65 GHz)
a(10.65 GHz/
18.7 GHz)
Evergreen
needleleaf forest
0.6782
0.6042
–0.6524
–0.5102
Evergreen
broadleaf forest
–0.0351
–0.0833
0.0312
0.0801
Deciduous
needleleaf forest
0.8715
0.8324
–0.8369
–0.7722
Deciduous
broadleaf forest
0.1915
0.5995
–0.1221
–0.5384
Mixed forest
0.5237
0.5151
–0.4728
–0.4405
Shrubland
0.5342
0.3629
–0.5527
–0.3672
Woody savannas
0.5040
0.3820
–0.5057
–0.3958
Savannas
0.6534
0.4527
–0.6564
–0.4673
Grasslands
0.7187
0.7131
–0.6979
–0.6961
Croplands
0.5243
0.4348
–0.5078
–0.4271
Barren or sparsely
vegetated
0.0683
0.0291
–0.0562
–0.0241
Multiscale Hydrologic Remote Sensing: Perspectives and Applications
NDVI and the MVIs for different vegetation types/land covers, (2) scatter plot analysis of NDVI versus the MVIs, and (3) selected samples of data to evaluate what
complementary vegetation information is provided by the MVIs.
Table 18.3 summarizes the global mean values of the correlation coefficients of
the AMSR-E MVIs and the MODIS NDVI in the year 2003 for each major land
vegetation cover type from the IGBP global map. Figure 18.5 shows the global distribution of the correlation coefficients R for the B values. This analysis was limited
to the B values because of the similarities in the correlation coefficients in both
their distribution pattern and magnitudes for A and B from each frequency pair.
The highest correlations were found in regions of deciduous needleleaf forest and
grassland, where the correlation coefficients were 0.77 and 0.69 for NDVI with A
and B, respectively. Land cover classes showing moderate correlations (R = 0.36–
0.68) included evergreen needleleaf forest, mixed forest, woody savannas, savannas,
shrublands, and croplands. No correlation was found between the MVIs and NDVI
for the evergreen broadleaf forest and barren or desert. These results are expected,
because there is no significant change in NDVI measurements during the year for
an evergreen broadleaf forest, and there is no vegetation in barren or desert areas.
The global statistical mean values for the deciduous broadleaf forest regions
indicated that the correlation is extremely low for the low-frequency-pair MVIs
(A = 0.19 and B = –0.12). However, there was a rather high correlation for the highfrequency-pair MVIs. Regions of evergreen broadleaf forest are mainly located in
TABLE 18.3
Global Mean Values of Correlation Coefficients of MVIs and NDVI for
Different Vegetation Types in 2003
Land Cover
a(6.925 GHz/
10.65 GHz)
a(10.65 GHz/
18.7 GHz)
B(6.925 GHz/
10.65 GHz)
a(10.65 GHz/
18.7 GHz)
Evergreen
needleleaf forest
0.6782
0.6042
–0.6524
–0.5102
Evergreen
broadleaf forest
–0.0351
–0.0833
0.0312
0.0801
Deciduous
needleleaf forest
0.8715
0.8324
–0.8369
–0.7722
Deciduous
broadleaf forest
0.1915
0.5995
–0.1221
–0.5384
Mixed forest
0.5237
0.5151
–0.4728
–0.4405
Shrubland
0.5342
0.3629
–0.5527
–0.3672
Woody savannas
0.5040
0.3820
–0.5057
–0.3958
Savannas
0.6534
0.4527
–0.6564
–0.4673
Grasslands
0.7187
0.7131
–0.6979
–0.6961
Croplands
0.5243
0.4348
–0.5078
–0.4271
Barren or sparsely
vegetated
0.0683
0.0291
–0.0562
–0.0241