

433
Microwave Vegetation Indices from Satellite Passive Microwave Sensors
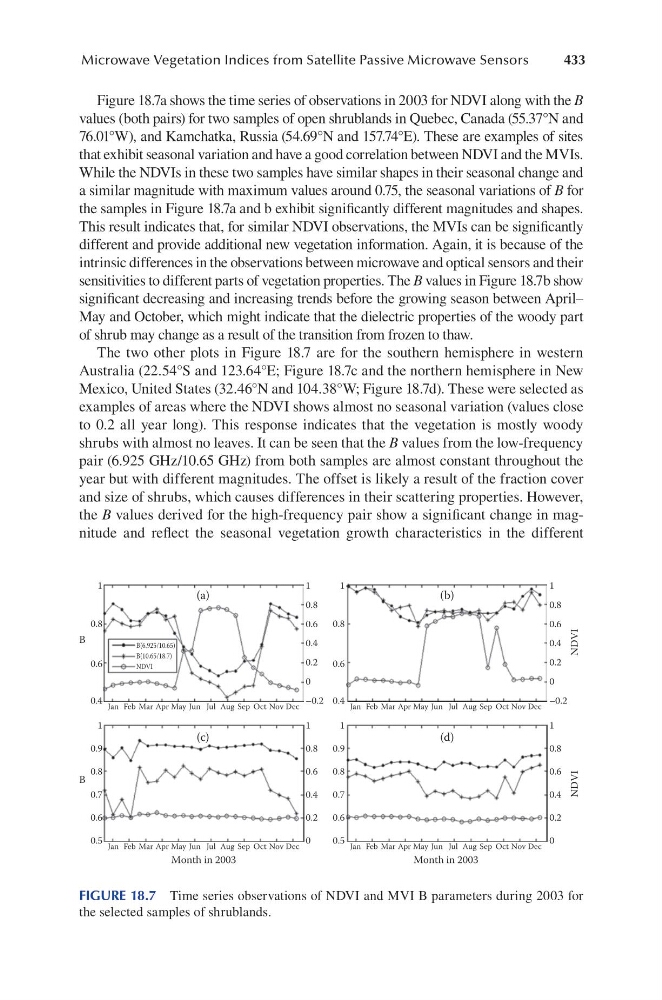
Figure 18.7a shows the time series of observations in 2003 for NDVI along with the B
values (both pairs) for two samples of open shrublands in Quebec, Canada (55.37°N and
76.01°W), and Kamchatka, Russia (54.69°N and 157.74°E). These are examples of sites
that exhibit seasonal variation and have a good correlation between NDVI and the MVIs.
While the NDVIs in these two samples have similar shapes in their seasonal change and
a similar magnitude with maximum values around 0.75, the seasonal variations of B for
the samples in Figure 18.7a and b exhibit significantly different magnitudes and shapes.
This result indicates that, for similar NDVI observations, the MVIs can be significantly
different and provide additional new vegetation information. Again, it is because of the
intrinsic differences in the observations between microwave and optical sensors and their
sensitivities to different parts of vegetation properties. The B values in Figure 18.7b show
significant decreasing and increasing trends before the growing season between April–
May and October, which might indicate that the dielectric properties of the woody part
of shrub may change as a result of the transition from frozen to thaw.
The two other plots in Figure 18.7 are for the southern hemisphere in western
Australia (22.54°S and 123.64°E; Figure 18.7c and the northern hemisphere in New
Mexico, United States (32.46°N and 104.38°W; Figure 18.7d). These were selected as
examples of areas where the NDVI shows almost no seasonal variation (values close
to 0.2 all year long). This response indicates that the vegetation is mostly woody
shrubs with almost no leaves. It can be seen that the B values from the low-frequency
pair (6.925 GHz/10.65 GHz) from both samples are almost constant throughout the
year but with different magnitudes. The offset is likely a result of the fraction cover
and size of shrubs, which causes differences in their scattering properties. However,
the B values derived for the high-frequency pair show a significant change in magnitude and reflect the seasonal vegetation growth characteristics in the different
1
0.8
0.6
0.4
1
0.8
0.6
–0.2
0.4
0.2
0
B
Jan Feb Mar Apr May Jun Jul Aug Sep Oct Nov Dec
1
0.8
0.6
0.4
1
0.8
0.6
–0.2
0.4
0.2
0
Jan Feb Mar Apr May Jun Jul Aug Sep Oct Nov Dec
1
0.8
0.6
0
0.4
0.2
B
Month in 2003
Month in 2003
NDVI
NDVI
Jan Feb Mar Apr May Jun Jul Aug Sep Oct Nov Dec
1
0.9
0.8
0.7
0.6
0.5
1
0.9
0.8
0.7
0.6
0.5
1
0.8
0.6
0
0.4
0.2
Jan Feb Mar Apr May Jun Jul Aug Sep Oct Nov Dec
(a)
(b)
(c)
(d)
B(6.925/10.65)
B(10.65/18.7)
NDVI
FIGURE 18.7 Time series observations of NDVI and MVI B parameters during 2003 for
the selected samples of shrublands.
Microwave Vegetation Indices from Satellite Passive Microwave Sensors
Figure 18.7a shows the time series of observations in 2003 for NDVI along with the B
values (both pairs) for two samples of open shrublands in Quebec, Canada (55.37°N and
76.01°W), and Kamchatka, Russia (54.69°N and 157.74°E). These are examples of sites
that exhibit seasonal variation and have a good correlation between NDVI and the MVIs.
While the NDVIs in these two samples have similar shapes in their seasonal change and
a similar magnitude with maximum values around 0.75, the seasonal variations of B for
the samples in Figure 18.7a and b exhibit significantly different magnitudes and shapes.
This result indicates that, for similar NDVI observations, the MVIs can be significantly
different and provide additional new vegetation information. Again, it is because of the
intrinsic differences in the observations between microwave and optical sensors and their
sensitivities to different parts of vegetation properties. The B values in Figure 18.7b show
significant decreasing and increasing trends before the growing season between April–
May and October, which might indicate that the dielectric properties of the woody part
of shrub may change as a result of the transition from frozen to thaw.
The two other plots in Figure 18.7 are for the southern hemisphere in western
Australia (22.54°S and 123.64°E; Figure 18.7c and the northern hemisphere in New
Mexico, United States (32.46°N and 104.38°W; Figure 18.7d). These were selected as
examples of areas where the NDVI shows almost no seasonal variation (values close
to 0.2 all year long). This response indicates that the vegetation is mostly woody
shrubs with almost no leaves. It can be seen that the B values from the low-frequency
pair (6.925 GHz/10.65 GHz) from both samples are almost constant throughout the
year but with different magnitudes. The offset is likely a result of the fraction cover
and size of shrubs, which causes differences in their scattering properties. However,
the B values derived for the high-frequency pair show a significant change in magnitude and reflect the seasonal vegetation growth characteristics in the different
1
0.8
0.6
0.4
1
0.8
0.6
–0.2
0.4
0.2
0
B
Jan Feb Mar Apr May Jun Jul Aug Sep Oct Nov Dec
1
0.8
0.6
0.4
1
0.8
0.6
–0.2
0.4
0.2
0
Jan Feb Mar Apr May Jun Jul Aug Sep Oct Nov Dec
1
0.8
0.6
0
0.4
0.2
B
Month in 2003
Month in 2003
NDVI
NDVI
Jan Feb Mar Apr May Jun Jul Aug Sep Oct Nov Dec
1
0.9
0.8
0.7
0.6
0.5
1
0.9
0.8
0.7
0.6
0.5
1
0.8
0.6
0
0.4
0.2
Jan Feb Mar Apr May Jun Jul Aug Sep Oct Nov Dec
(a)
(b)
(c)
(d)
B(6.925/10.65)
B(10.65/18.7)
NDVI
FIGURE 18.7 Time series observations of NDVI and MVI B parameters during 2003 for
the selected samples of shrublands.