

420
Multiscale Hydrologic Remote Sensing: Perspectives and Applications
A f f
T f
T f
B f f
T f
T
Bv
Bh
Bv
Bh
( , )
( )
( )
( , )
( )
1 2
2
2
1 2
1
1
2
=
+
−
⋅
+ ( ( )
f 1
(
)
.
(18.15)
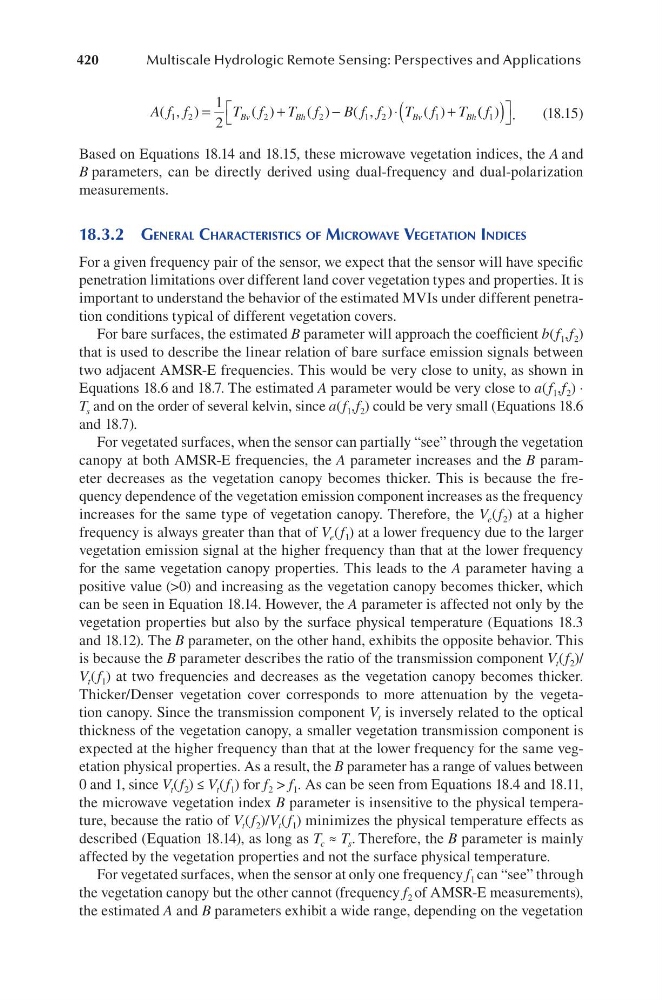
Based on Equations 18.14 and 18.15, these microwave vegetation indices, the A and
B parameters, can be directly derived using dual-frequency and dual-polarization
measurements.
18.3.2 geneRal chaRacteRiSticS of MicRowave vegetation indiceS
For a given frequency pair of the sensor, we expect that the sensor will have specific
penetration limitations over different land cover vegetation types and properties. It is
important to understand the behavior of the estimated MVIs under different penetration conditions typical of different vegetation covers.
For bare surfaces, the estimated B parameter will approach the coefficient b(f 1 ,f 2 )
that is used to describe the linear relation of bare surface emission signals between
two adjacent AMSR-E frequencies. This would be very close to unity, as shown in
Equations 18.6 and 18.7. The estimated A parameter would be very close to a(f 1 ,f 2 ) ∙
T s and on the order of several kelvin, since a(f 1 ,f 2 ) could be very small (Equations 18.6
and 18.7).
For vegetated surfaces, when the sensor can partially “see” through the vegetation
canopy at both AMSR-E frequencies, the A parameter increases and the B parameter decreases as the vegetation canopy becomes thicker. This is because the frequency dependence of the vegetation emission component increases as the frequency
increases for the same type of vegetation canopy. Therefore, the V e (f 2 ) at a higher
frequency is always greater than that of V e (f 1 ) at a lower frequency due to the larger
vegetation emission signal at the higher frequency than that at the lower frequency
for the same vegetation canopy properties. This leads to the A parameter having a
positive value (>0) and increasing as the vegetation canopy becomes thicker, which
can be seen in Equation 18.14. However, the A parameter is affected not only by the
vegetation properties but also by the surface physical temperature (Equations 18.3
and 18.12). The B parameter, on the other hand, exhibits the opposite behavior. This
is because the B parameter describes the ratio of the transmission component V t (f 2 )/
V t (f 1 ) at two frequencies and decreases as the vegetation canopy becomes thicker.
Thicker/Denser vegetation cover corresponds to more attenuation by the vegetation canopy. Since the transmission component V t is inversely related to the optical
thickness of the vegetation canopy, a smaller vegetation transmission component is
expected at the higher frequency than that at the lower frequency for the same vegetation physical properties. As a result, the B parameter has a range of values between
0 and 1, since V t (f 2 ) ≤ V t (f 1 ) for f 2 > f 1 . As can be seen from Equations 18.4 and 18.11,
the microwave vegetation index B parameter is insensitive to the physical temperature, because the ratio of V t (f 2 )/V t (f 1 ) minimizes the physical temperature effects as
described (Equation 18.14), as long as T c ≈ T s . Therefore, the B parameter is mainly
affected by the vegetation properties and not the surface physical temperature.
For vegetated surfaces, when the sensor at only one frequency f 1 can “see” through
the vegetation canopy but the other cannot (frequency f 2 of AMSR-E measurements),
the estimated A and B parameters exhibit a wide range, depending on the vegetation
Multiscale Hydrologic Remote Sensing: Perspectives and Applications
A f f
T f
T f
B f f
T f
T
Bv
Bh
Bv
Bh
( , )
( )
( )
( , )
( )
1 2
2
2
1 2
1
1
2
=
+
−
⋅
+ ( ( )
f 1
(
)
.
(18.15)
Based on Equations 18.14 and 18.15, these microwave vegetation indices, the A and
B parameters, can be directly derived using dual-frequency and dual-polarization
measurements.
18.3.2 geneRal chaRacteRiSticS of MicRowave vegetation indiceS
For a given frequency pair of the sensor, we expect that the sensor will have specific
penetration limitations over different land cover vegetation types and properties. It is
important to understand the behavior of the estimated MVIs under different penetration conditions typical of different vegetation covers.
For bare surfaces, the estimated B parameter will approach the coefficient b(f 1 ,f 2 )
that is used to describe the linear relation of bare surface emission signals between
two adjacent AMSR-E frequencies. This would be very close to unity, as shown in
Equations 18.6 and 18.7. The estimated A parameter would be very close to a(f 1 ,f 2 ) ∙
T s and on the order of several kelvin, since a(f 1 ,f 2 ) could be very small (Equations 18.6
and 18.7).
For vegetated surfaces, when the sensor can partially “see” through the vegetation
canopy at both AMSR-E frequencies, the A parameter increases and the B parameter decreases as the vegetation canopy becomes thicker. This is because the frequency dependence of the vegetation emission component increases as the frequency
increases for the same type of vegetation canopy. Therefore, the V e (f 2 ) at a higher
frequency is always greater than that of V e (f 1 ) at a lower frequency due to the larger
vegetation emission signal at the higher frequency than that at the lower frequency
for the same vegetation canopy properties. This leads to the A parameter having a
positive value (>0) and increasing as the vegetation canopy becomes thicker, which
can be seen in Equation 18.14. However, the A parameter is affected not only by the
vegetation properties but also by the surface physical temperature (Equations 18.3
and 18.12). The B parameter, on the other hand, exhibits the opposite behavior. This
is because the B parameter describes the ratio of the transmission component V t (f 2 )/
V t (f 1 ) at two frequencies and decreases as the vegetation canopy becomes thicker.
Thicker/Denser vegetation cover corresponds to more attenuation by the vegetation canopy. Since the transmission component V t is inversely related to the optical
thickness of the vegetation canopy, a smaller vegetation transmission component is
expected at the higher frequency than that at the lower frequency for the same vegetation physical properties. As a result, the B parameter has a range of values between
0 and 1, since V t (f 2 ) ≤ V t (f 1 ) for f 2 > f 1 . As can be seen from Equations 18.4 and 18.11,
the microwave vegetation index B parameter is insensitive to the physical temperature, because the ratio of V t (f 2 )/V t (f 1 ) minimizes the physical temperature effects as
described (Equation 18.14), as long as T c ≈ T s . Therefore, the B parameter is mainly
affected by the vegetation properties and not the surface physical temperature.
For vegetated surfaces, when the sensor at only one frequency f 1 can “see” through
the vegetation canopy but the other cannot (frequency f 2 of AMSR-E measurements),
the estimated A and B parameters exhibit a wide range, depending on the vegetation