

361
Airborne Water Vapor Differential Absorption Lidar
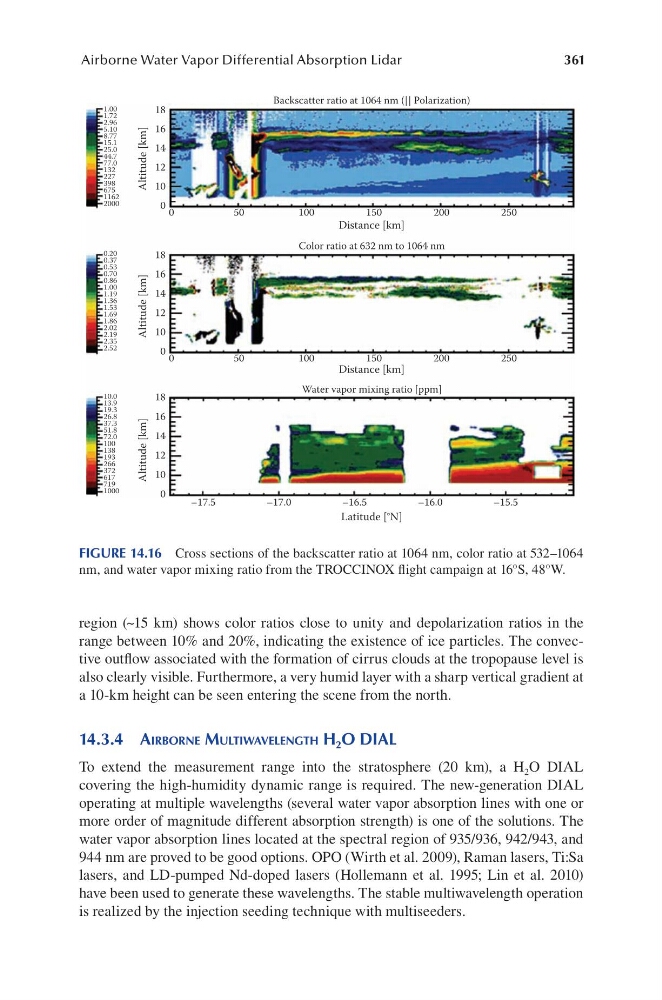
region (~15 km) shows color ratios close to unity and depolarization ratios in the
range between 10% and 20%, indicating the existence of ice particles. The convective outflow associated with the formation of cirrus clouds at the tropopause level is
also clearly visible. Furthermore, a very humid layer with a sharp vertical gradient at
a 10-km height can be seen entering the scene from the north.
14.3.4 aiRBoRne Multiwavelength h 2 o dial
To extend the measurement range into the stratosphere (20 km), a H 2 O DIAL
covering the high-humidity dynamic range is required. The new-generation DIAL
operating at multiple wavelengths (several water vapor absorption lines with one or
more order of magnitude different absorption strength) is one of the solutions. The
water vapor absorption lines located at the spectral region of 935/936, 942/943, and
944 nm are proved to be good options. OPO (Wirth et al. 2009), Raman lasers, Ti:Sa
lasers, and LD-pumped Nd-doped lasers (Hollemann et al. 1995; Lin et al. 2010)
have been used to generate these wavelengths. The stable multiwavelength operation
is realized by the injection seeding technique with multiseeders.
Backscatter ratio at 1064 nm (|| Polarization)
Color ratio at 632 nm to 1064 nm
Water vapor mixing ratio [ppm]
Latitude [°N]
Distance [km]
Distance [km]
Altitude [km]
Altitude [km]
Altitude [km]
18
1.00
1.72
2.96
5.10
8.77
15.1
25.0
44.7
77.0
132
227
398
675
1162
2000
0.20
0.37
0.53
0.70
0.86
1.00
1.19
1.36
1.53
1.69
1.86
2.02
2.19
2.35
2.52
10.0
13.9
19.3
26.8
37.3
51.8
72.0
100
138
193
266
372
617
719
1000
16
14
12
10
0 0
50
100
150
200
250
18
16
14
12
10
0
18
16
14
12
10
0
0
–17.5
–17.0
–16.5
–16.0
–15.5
50
100
150
200
250
FIGURE 14.16 Cross sections of the backscatter ratio at 1064 nm, color ratio at 532–1064
nm, and water vapor mixing ratio from the TROCCINOX flight campaign at 16°S, 48°W.
Airborne Water Vapor Differential Absorption Lidar
region (~15 km) shows color ratios close to unity and depolarization ratios in the
range between 10% and 20%, indicating the existence of ice particles. The convective outflow associated with the formation of cirrus clouds at the tropopause level is
also clearly visible. Furthermore, a very humid layer with a sharp vertical gradient at
a 10-km height can be seen entering the scene from the north.
14.3.4 aiRBoRne Multiwavelength h 2 o dial
To extend the measurement range into the stratosphere (20 km), a H 2 O DIAL
covering the high-humidity dynamic range is required. The new-generation DIAL
operating at multiple wavelengths (several water vapor absorption lines with one or
more order of magnitude different absorption strength) is one of the solutions. The
water vapor absorption lines located at the spectral region of 935/936, 942/943, and
944 nm are proved to be good options. OPO (Wirth et al. 2009), Raman lasers, Ti:Sa
lasers, and LD-pumped Nd-doped lasers (Hollemann et al. 1995; Lin et al. 2010)
have been used to generate these wavelengths. The stable multiwavelength operation
is realized by the injection seeding technique with multiseeders.
Backscatter ratio at 1064 nm (|| Polarization)
Color ratio at 632 nm to 1064 nm
Water vapor mixing ratio [ppm]
Latitude [°N]
Distance [km]
Distance [km]
Altitude [km]
Altitude [km]
Altitude [km]
18
1.00
1.72
2.96
5.10
8.77
15.1
25.0
44.7
77.0
132
227
398
675
1162
2000
0.20
0.37
0.53
0.70
0.86
1.00
1.19
1.36
1.53
1.69
1.86
2.02
2.19
2.35
2.52
10.0
13.9
19.3
26.8
37.3
51.8
72.0
100
138
193
266
372
617
719
1000
16
14
12
10
0 0
50
100
150
200
250
18
16
14
12
10
0
18
16
14
12
10
0
0
–17.5
–17.0
–16.5
–16.0
–15.5
50
100
150
200
250
FIGURE 14.16 Cross sections of the backscatter ratio at 1064 nm, color ratio at 532–1064
nm, and water vapor mixing ratio from the TROCCINOX flight campaign at 16°S, 48°W.