

360
Multiscale Hydrologic Remote Sensing: Perspectives and Applications
apertures placed at the telescope focal plane in each channel. The field of view is
typically set to 2 mrad for the water vapor channel and 1 mrad for the aerosol chan1 mrad for the aerosol chan1 mrad for the aerosol channels. To suppress solar background radiation, light passes through the temperaturestabilized filters with a 1-nm (FWHM) bandwidth before reaching the detectors.
The signals are digitized with a resolution of 14 bit at a sampling rate of 10 MHz and
stored on a hard disk, magnetic tape, and removable magneto-optic disk. All storage
and system are controlled by an especially designed computer that also allows realtime monitoring of backscatter profiles and important aircraft parameters.
14.3.3.4 Application Examples
This DIAL system was aboard the Falcon 20 aircraft and performed 13 local flights
during the campaign Tropical Convection, Cirrus and Nitrogen Oxides Experiment
(TROCCINOX), which took place in Brazil. The main focus of this campaign is the
investigation of the convection and corresponding modification of the humidity field
at upper tropospheric levels. Hence, anvils of deep convective cumulonimbus (Cb)
clouds are investigated, with a focus on the outfl ow of air masses at the top transare investigated, with a focus on the outfl ow of air masses at the top transinvestigated, with a focus on the outflow of air masses at the top transthe top transthe top transported upward from the low or middle troposphere.
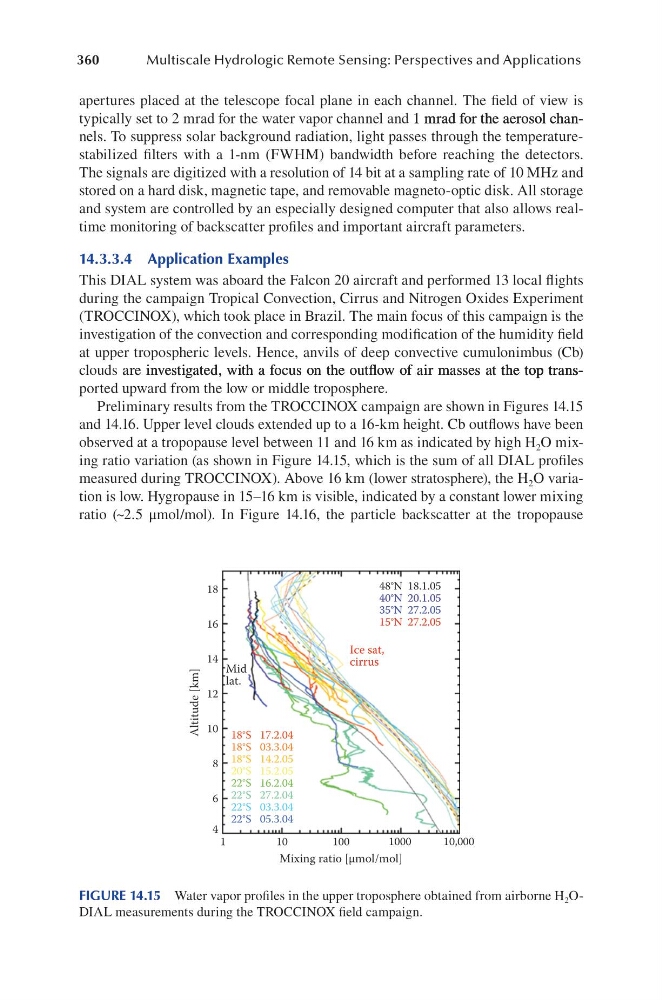
Preliminary results from the TROCCINOX campaign are shown in Figures 14.15
and 14.16. Upper level clouds extended up to a 16-km height. Cb outflows have been
observed at a tropopause level between 11 and 16 km as indicated by high H 2 O mixing ratio variation (as shown in Figure 14.15, which is the sum of all DIAL profiles
measured during TROCCINOX). Above 16 km (lower stratosphere), the H 2 O variation is low. Hygropause in 15–16 km is visible, indicated by a constant lower mixing
ratio (~2.5 μmol/mol). In Figure 14.16, the particle backscatter at the tropopause
18
16
14 Mid
lat.
Ice sat,
cirrus
48°N 18.1.05
40°N 20.1.05
35°N 27.2.05
15°N 27.2.05
18°S
18°S
18°S
20°S
22°S
22°S
22°S
22°S
17.2.04
03.3.04
14.2.05
15.2.05
16.2.04
27.2.04
03.3.04
05.3.04
12
10
8
6
4
1
10
100
Mixing ratio [µmol/mol]
Altitude [km]
1000
10,000
FIGURE 14.15 Water vapor profiles in the upper troposphere obtained from airborne H 2 ODIAL measurements during the TROCCINOX field campaign.
Multiscale Hydrologic Remote Sensing: Perspectives and Applications
apertures placed at the telescope focal plane in each channel. The field of view is
typically set to 2 mrad for the water vapor channel and 1 mrad for the aerosol chan1 mrad for the aerosol chan1 mrad for the aerosol channels. To suppress solar background radiation, light passes through the temperaturestabilized filters with a 1-nm (FWHM) bandwidth before reaching the detectors.
The signals are digitized with a resolution of 14 bit at a sampling rate of 10 MHz and
stored on a hard disk, magnetic tape, and removable magneto-optic disk. All storage
and system are controlled by an especially designed computer that also allows realtime monitoring of backscatter profiles and important aircraft parameters.
14.3.3.4 Application Examples
This DIAL system was aboard the Falcon 20 aircraft and performed 13 local flights
during the campaign Tropical Convection, Cirrus and Nitrogen Oxides Experiment
(TROCCINOX), which took place in Brazil. The main focus of this campaign is the
investigation of the convection and corresponding modification of the humidity field
at upper tropospheric levels. Hence, anvils of deep convective cumulonimbus (Cb)
clouds are investigated, with a focus on the outfl ow of air masses at the top transare investigated, with a focus on the outfl ow of air masses at the top transinvestigated, with a focus on the outflow of air masses at the top transthe top transthe top transported upward from the low or middle troposphere.
Preliminary results from the TROCCINOX campaign are shown in Figures 14.15
and 14.16. Upper level clouds extended up to a 16-km height. Cb outflows have been
observed at a tropopause level between 11 and 16 km as indicated by high H 2 O mixing ratio variation (as shown in Figure 14.15, which is the sum of all DIAL profiles
measured during TROCCINOX). Above 16 km (lower stratosphere), the H 2 O variation is low. Hygropause in 15–16 km is visible, indicated by a constant lower mixing
ratio (~2.5 μmol/mol). In Figure 14.16, the particle backscatter at the tropopause
18
16
14 Mid
lat.
Ice sat,
cirrus
48°N 18.1.05
40°N 20.1.05
35°N 27.2.05
15°N 27.2.05
18°S
18°S
18°S
20°S
22°S
22°S
22°S
22°S
17.2.04
03.3.04
14.2.05
15.2.05
16.2.04
27.2.04
03.3.04
05.3.04
12
10
8
6
4
1
10
100
Mixing ratio [µmol/mol]
Altitude [km]
1000
10,000
FIGURE 14.15 Water vapor profiles in the upper troposphere obtained from airborne H 2 ODIAL measurements during the TROCCINOX field campaign.