

355
Airborne Water Vapor Differential Absorption Lidar
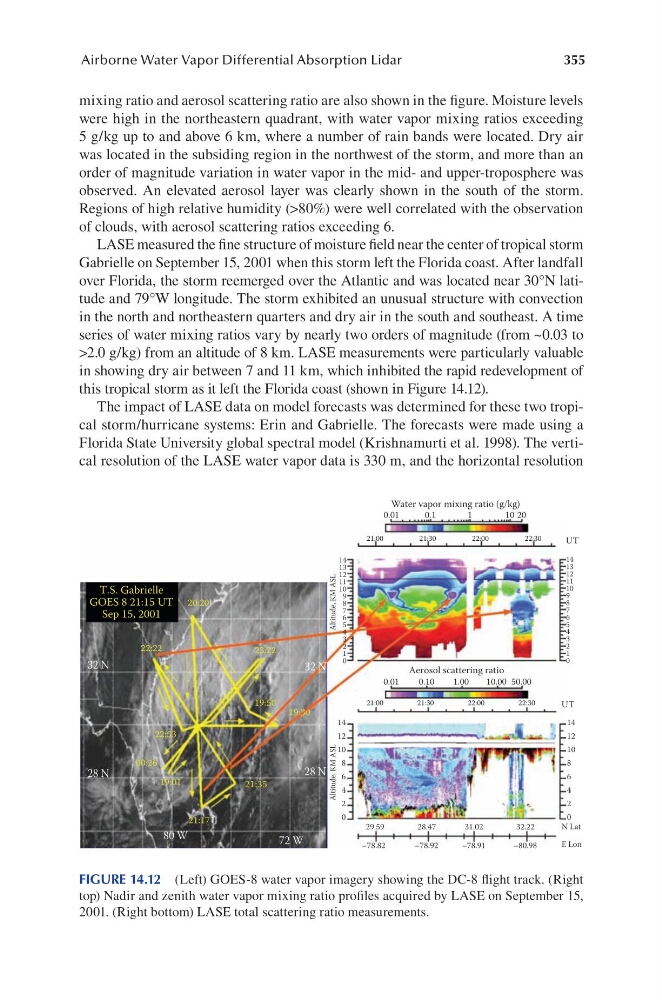
mixing ratio and aerosol scattering ratio are also shown in the figure. Moisture levels
were high in the northeastern quadrant, with water vapor mixing ratios exceeding
5 g/kg up to and above 6 km, where a number of rain bands were located. Dry air
was located in the subsiding region in the northwest of the storm, and more than an
order of magnitude variation in water vapor in the mid- and upper-troposphere was
observed. An elevated aerosol layer was clearly shown in the south of the storm.
Regions of high relative humidity (>80%) were well correlated with the observation
of clouds, with aerosol scattering ratios exceeding 6.
LASE measured the fine structure of moisture field near the center of tropical storm
Gabrielle on September 15, 2001 when this storm left the Florida coast. After landfall
over Florida, the storm reemerged over the Atlantic and was located near 30°N latitude and 79°W longitude. The storm exhibited an unusual structure with convection
in the north and northeastern quarters and dry air in the south and southeast. A time
series of water mixing ratios vary by nearly two orders of magnitude (from ~0.03 to
>2.0 g/kg) from an altitude of 8 km. LASE measurements were particularly valuable
in showing dry air between 7 and 11 km, which inhibited the rapid redevelopment of
this tropical storm as it left the Florida coast (shown in Figure 14.12).
The impact of LASE data on model forecasts was determined for these two tropical storm/hurricane systems: Erin and Gabrielle. The forecasts were made using a
Florida State University global spectral model (Krishnamurti et al. 1998). The vertical resolution of the LASE water vapor data is 330 m, and the horizontal resolution
T.S. Gabrielle
GOES 8 21:15 UT
Sep 15, 2001
Water vapor mixing ratio (g/kg)
Aerosol scattering ratio
0.01
0.01
0.10
1.00
10.00 50.00
0.1
1
10 20
UT
UT
14
13
12
11
10
8
9
6
7
4
5
2
1
0
3
14
13
12
11
10
8
9
6
7
4
5
2
1
0
3
14
12
10
8
6
4
2
14
12
10
8
6
4
2
0
0
21:00
21:30
22:00
22:30
21:00
21:30
22:00
22:30
Altitude, KM ASL
Altitude, KM ASL
29.59
28.47
32.22
31.02
–78.82
–78.92
–78.91
–80.98
E Lon
N Lat
72 W
80 W
28 N
32 N
20:20
23:22
19:50
19:30
21:35
21:17
19:01
00:26
22:53
22:22
28 N
32 N
FIGURE 14.12 (Left) GOES-8 water vapor imagery showing the DC-8 flight track. (Right
top) Nadir and zenith water vapor mixing ratio profiles acquired by LASE on September 15,
2001. (Right bottom) LASE total scattering ratio measurements.
Airborne Water Vapor Differential Absorption Lidar
mixing ratio and aerosol scattering ratio are also shown in the figure. Moisture levels
were high in the northeastern quadrant, with water vapor mixing ratios exceeding
5 g/kg up to and above 6 km, where a number of rain bands were located. Dry air
was located in the subsiding region in the northwest of the storm, and more than an
order of magnitude variation in water vapor in the mid- and upper-troposphere was
observed. An elevated aerosol layer was clearly shown in the south of the storm.
Regions of high relative humidity (>80%) were well correlated with the observation
of clouds, with aerosol scattering ratios exceeding 6.
LASE measured the fine structure of moisture field near the center of tropical storm
Gabrielle on September 15, 2001 when this storm left the Florida coast. After landfall
over Florida, the storm reemerged over the Atlantic and was located near 30°N latitude and 79°W longitude. The storm exhibited an unusual structure with convection
in the north and northeastern quarters and dry air in the south and southeast. A time
series of water mixing ratios vary by nearly two orders of magnitude (from ~0.03 to
>2.0 g/kg) from an altitude of 8 km. LASE measurements were particularly valuable
in showing dry air between 7 and 11 km, which inhibited the rapid redevelopment of
this tropical storm as it left the Florida coast (shown in Figure 14.12).
The impact of LASE data on model forecasts was determined for these two tropical storm/hurricane systems: Erin and Gabrielle. The forecasts were made using a
Florida State University global spectral model (Krishnamurti et al. 1998). The vertical resolution of the LASE water vapor data is 330 m, and the horizontal resolution
T.S. Gabrielle
GOES 8 21:15 UT
Sep 15, 2001
Water vapor mixing ratio (g/kg)
Aerosol scattering ratio
0.01
0.01
0.10
1.00
10.00 50.00
0.1
1
10 20
UT
UT
14
13
12
11
10
8
9
6
7
4
5
2
1
0
3
14
13
12
11
10
8
9
6
7
4
5
2
1
0
3
14
12
10
8
6
4
2
14
12
10
8
6
4
2
0
0
21:00
21:30
22:00
22:30
21:00
21:30
22:00
22:30
Altitude, KM ASL
Altitude, KM ASL
29.59
28.47
32.22
31.02
–78.82
–78.92
–78.91
–80.98
E Lon
N Lat
72 W
80 W
28 N
32 N
20:20
23:22
19:50
19:30
21:35
21:17
19:01
00:26
22:53
22:22
28 N
32 N
FIGURE 14.12 (Left) GOES-8 water vapor imagery showing the DC-8 flight track. (Right
top) Nadir and zenith water vapor mixing ratio profiles acquired by LASE on September 15,
2001. (Right bottom) LASE total scattering ratio measurements.