

356
Multiscale Hydrologic Remote Sensing: Perspectives and Applications
is about 14 km. In this study, the analysis was performed horizontally at a resolution T126 (i.e., this has a transform grid separation of roughly 1° latitude) and 14
sigma levels vertically. All the observations were processed in bins of volume 25
km × 25 km × 300 m. In each bin, the observations were processed according to
their distance from the respective center of the bin. A value of 10% observational
error corresponding to relative humidity was assigned to these observations in the
data analysis. The control (CTRL) forecasts included European Center for Medium
Range Weather Forecasts (ECMWF) plus rain rate estimates in its initial state at the
resolution T126. The experiment LASE is the same, with the addition of the LASE
water vapor profiles.
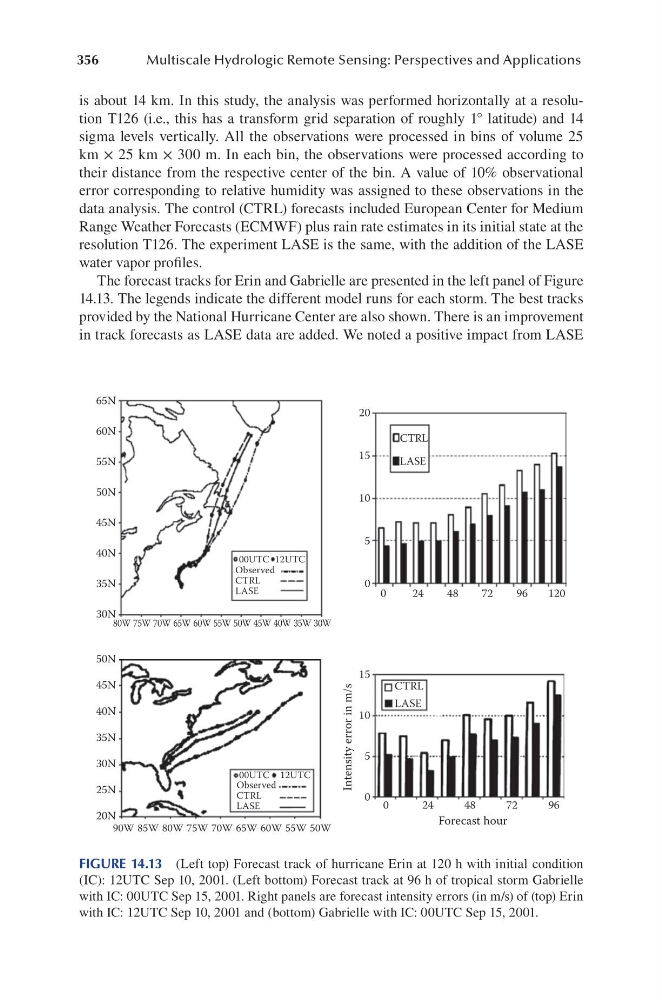
The forecast tracks for Erin and Gabrielle are presented in the left panel of Figure
14.13. The legends indicate the different model runs for each storm. The best tracks
provided by the National Hurricane Center are also shown. There is an improvement
in track forecasts as LASE data are added. We noted a positive impact from LASE
65N
60N
55N
50N
45N
40N
35N
30N
50N
45N
40N
35N
30N
25N
20N
20
15
10
5
0
15
10
5
0
0
24
48
72
96
120
0
24
48
72
96
Forecast hour
Intensity error in m/s
CTRL
00UTC
Observed
CTRL
LASE
12UTC
00UTC
Observed
CTRL
LASE
12UTC
LASE
CTRL
LASE
30W
80W 75W 70W 65W 60W 55W 50W 45W 40W 35W
90W 85W 80W 75W 70W 65W 60W 55W 50W
FIGURE 14.13 (Left top) Forecast track of hurricane Erin at 120 h with initial condition
(IC): 12UTC Sep 10, 2001. (Left bottom) Forecast track at 96 h of tropical storm Gabrielle
with IC: 00UTC Sep 15, 2001. Right panels are forecast intensity errors (in m/s) of (top) Erin
with IC: 12UTC Sep 10, 2001 and (bottom) Gabrielle with IC: 00UTC Sep 15, 2001.
Multiscale Hydrologic Remote Sensing: Perspectives and Applications
is about 14 km. In this study, the analysis was performed horizontally at a resolution T126 (i.e., this has a transform grid separation of roughly 1° latitude) and 14
sigma levels vertically. All the observations were processed in bins of volume 25
km × 25 km × 300 m. In each bin, the observations were processed according to
their distance from the respective center of the bin. A value of 10% observational
error corresponding to relative humidity was assigned to these observations in the
data analysis. The control (CTRL) forecasts included European Center for Medium
Range Weather Forecasts (ECMWF) plus rain rate estimates in its initial state at the
resolution T126. The experiment LASE is the same, with the addition of the LASE
water vapor profiles.
The forecast tracks for Erin and Gabrielle are presented in the left panel of Figure
14.13. The legends indicate the different model runs for each storm. The best tracks
provided by the National Hurricane Center are also shown. There is an improvement
in track forecasts as LASE data are added. We noted a positive impact from LASE
65N
60N
55N
50N
45N
40N
35N
30N
50N
45N
40N
35N
30N
25N
20N
20
15
10
5
0
15
10
5
0
0
24
48
72
96
120
0
24
48
72
96
Forecast hour
Intensity error in m/s
CTRL
00UTC
Observed
CTRL
LASE
12UTC
00UTC
Observed
CTRL
LASE
12UTC
LASE
CTRL
LASE
30W
80W 75W 70W 65W 60W 55W 50W 45W 40W 35W
90W 85W 80W 75W 70W 65W 60W 55W 50W
FIGURE 14.13 (Left top) Forecast track of hurricane Erin at 120 h with initial condition
(IC): 12UTC Sep 10, 2001. (Left bottom) Forecast track at 96 h of tropical storm Gabrielle
with IC: 00UTC Sep 15, 2001. Right panels are forecast intensity errors (in m/s) of (top) Erin
with IC: 12UTC Sep 10, 2001 and (bottom) Gabrielle with IC: 00UTC Sep 15, 2001.