

354
Multiscale Hydrologic Remote Sensing: Perspectives and Applications
thereby simultaneously providing data above and below the aircraft. Typical horizondata above and below the aircraft. Typical horizondata above and below the aircraft. Typical horizontal and vertical resolutions for water vapor profiles between 0.2- and 12-km altitude
are 14 km (1 min) and 330 m, respectively, for nadir and 70 km (3 min) and 990 m,
respectively, for zenith. In CAMEX-4, LASE was deployed on the NASA DC-8 airfor zenith. In CAMEX-4, LASE was deployed on the NASA DC-8 airfor zenith. In CAMEX-4, LASE was deployed on the NASA DC-8 airIn CAMEX-4, LASE was deployed on the NASA DC-8 airCAMEX-4, LASE was deployed on the NASA DC-8 airLASE was deployed on the NASA DC-8 airwas deployed on the NASA DC-8 airdeployed on the NASA DC-8 airdeployed on the NASA DC-8 aircraft and simultaneously measured high-resolution cross sections of water vapor
distributions above and below the aircraft to evaluate the impact of high-spa tial-resothe impact of high-spa tial-resothe impact of high-spa tial-resolution water vapor distributions on forecasts of hurricane track and intensity.
LASE measured water vapor profiles in the vicinity of Hurricanes Erin and
Humberto and Tropical Storm Gabrielle during five long-duration flights in CAMEX4, which occurred over the same region in August–September 2001 (Ferrare et al.
2002; Mahoney et al. 2002). Here the LASE measurements during Erin and Gabrielle
are described, and the impact on hurricane forecast is presented.
LASE measurements were made on 10 September 2001 to characterize the moisture environment associated with hurricane Erin, which was situated at 35.5°N
latitude and 65.1°W longitude. Sustained winds of 105 kts and a clear eye with a
diameter of 30 km were associated with this storm. The DC-8 flew at an altitude of
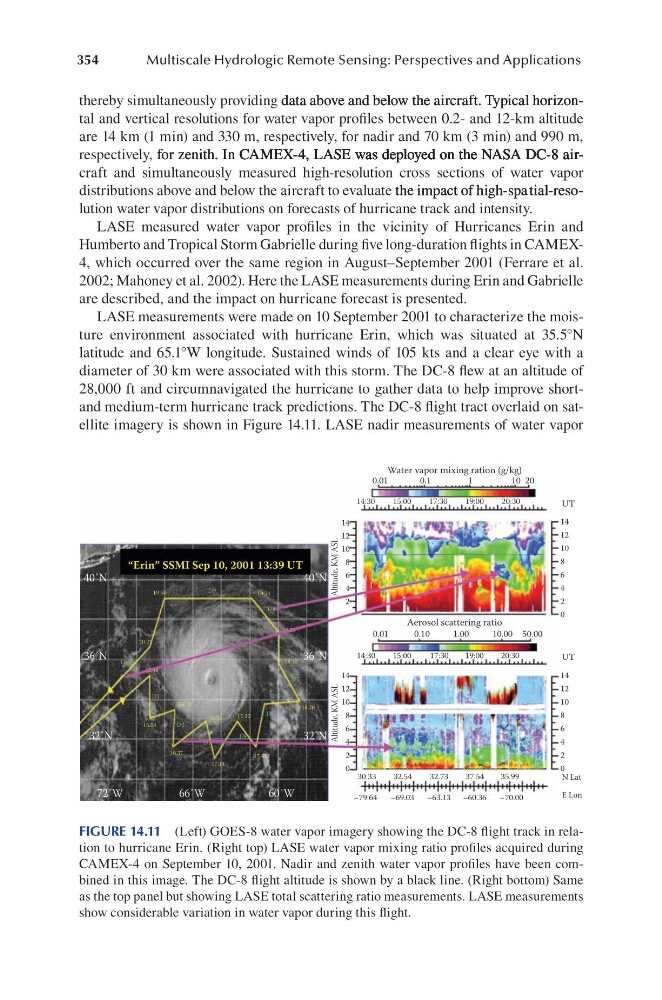
28,000 ft and circumnavigated the hurricane to gather data to help improve shortand medium-term hurricane track predictions. The DC-8 flight tract overlaid on satellite imagery is shown in Figure 14.11. LASE nadir measurements of water vapor
“Erin” SSMI Sep 10, 2001 13:39 UT
Water vapor mixing ration (g/kg)
Aerosol scattering ratio
0.01
0.01
0.10
1.00
10.00 50.00
0.1
1
10 20
UT
UT
14
12
10
8
6
4
2
14
12
10
8
6
4
2
0
14
12
10
8
6
4
2
0
14
12
10
8
6
4
2
0
Altitude, KM ASL
Altitude, KM ASL
14:30
17:30
20:30
15:00
19:00
14:30
30.33
32.54
37.54
35.99
32.73
–79.64
–69.03
–63.13 –60.36
–70.00
E Lon
N Lat
17:30
20:30
15:00
19:00
40˚N
36˚N
32˚N
40˚N
36˚N
32˚N
72˚W
66˚W
60˚W
19.58
D9
D8
D7
D6
D5
D4
D3
D2
D1
D11
20.21
19.14
18.55
18.40
18.20
17.47
17.30
16.56
17.14
16.37
16.10
16.04
15.48
FIGURE 14.11 (Left) GOES-8 water vapor imagery showing the DC-8 flight track in relation to hurricane Erin. (Right top) LASE water vapor mixing ratio profiles acquired during
CAMEX-4 on September 10, 2001. Nadir and zenith water vapor profiles have been combined in this image. The DC-8 flight altitude is shown by a black line. (Right bottom) Same
as the top panel but showing LASE total scattering ratio measurements. LASE measurements
show considerable variation in water vapor during this flight.
Multiscale Hydrologic Remote Sensing: Perspectives and Applications
thereby simultaneously providing data above and below the aircraft. Typical horizondata above and below the aircraft. Typical horizondata above and below the aircraft. Typical horizontal and vertical resolutions for water vapor profiles between 0.2- and 12-km altitude
are 14 km (1 min) and 330 m, respectively, for nadir and 70 km (3 min) and 990 m,
respectively, for zenith. In CAMEX-4, LASE was deployed on the NASA DC-8 airfor zenith. In CAMEX-4, LASE was deployed on the NASA DC-8 airfor zenith. In CAMEX-4, LASE was deployed on the NASA DC-8 airIn CAMEX-4, LASE was deployed on the NASA DC-8 airCAMEX-4, LASE was deployed on the NASA DC-8 airLASE was deployed on the NASA DC-8 airwas deployed on the NASA DC-8 airdeployed on the NASA DC-8 airdeployed on the NASA DC-8 aircraft and simultaneously measured high-resolution cross sections of water vapor
distributions above and below the aircraft to evaluate the impact of high-spa tial-resothe impact of high-spa tial-resothe impact of high-spa tial-resolution water vapor distributions on forecasts of hurricane track and intensity.
LASE measured water vapor profiles in the vicinity of Hurricanes Erin and
Humberto and Tropical Storm Gabrielle during five long-duration flights in CAMEX4, which occurred over the same region in August–September 2001 (Ferrare et al.
2002; Mahoney et al. 2002). Here the LASE measurements during Erin and Gabrielle
are described, and the impact on hurricane forecast is presented.
LASE measurements were made on 10 September 2001 to characterize the moisture environment associated with hurricane Erin, which was situated at 35.5°N
latitude and 65.1°W longitude. Sustained winds of 105 kts and a clear eye with a
diameter of 30 km were associated with this storm. The DC-8 flew at an altitude of
28,000 ft and circumnavigated the hurricane to gather data to help improve shortand medium-term hurricane track predictions. The DC-8 flight tract overlaid on satellite imagery is shown in Figure 14.11. LASE nadir measurements of water vapor
“Erin” SSMI Sep 10, 2001 13:39 UT
Water vapor mixing ration (g/kg)
Aerosol scattering ratio
0.01
0.01
0.10
1.00
10.00 50.00
0.1
1
10 20
UT
UT
14
12
10
8
6
4
2
14
12
10
8
6
4
2
0
14
12
10
8
6
4
2
0
14
12
10
8
6
4
2
0
Altitude, KM ASL
Altitude, KM ASL
14:30
17:30
20:30
15:00
19:00
14:30
30.33
32.54
37.54
35.99
32.73
–79.64
–69.03
–63.13 –60.36
–70.00
E Lon
N Lat
17:30
20:30
15:00
19:00
40˚N
36˚N
32˚N
40˚N
36˚N
32˚N
72˚W
66˚W
60˚W
19.58
D9
D8
D7
D6
D5
D4
D3
D2
D1
D11
20.21
19.14
18.55
18.40
18.20
17.47
17.30
16.56
17.14
16.37
16.10
16.04
15.48
FIGURE 14.11 (Left) GOES-8 water vapor imagery showing the DC-8 flight track in relation to hurricane Erin. (Right top) LASE water vapor mixing ratio profiles acquired during
CAMEX-4 on September 10, 2001. Nadir and zenith water vapor profiles have been combined in this image. The DC-8 flight altitude is shown by a black line. (Right bottom) Same
as the top panel but showing LASE total scattering ratio measurements. LASE measurements
show considerable variation in water vapor during this flight.