

17
Advanced Ground-Penetrating Radar for Soil Moisture Retrieval
moisture is measured within an antenna footprint of about 1 m 2 and with a penetration depth of about 10 cm.
Using the GPR mounted on the ATV, we acquired 3572 GPR point measurements in a 5.5-ha agricultural field in Cruchten, Luxembourg, on 13 March 2009.
The soil was bare with little vegetation and limited surface roughness, as neither
tillage nor other field work was performed for 5 months. Soil moisture was retrieved
by an inversion (see Equation 2.5) of the filtered GPR data, with soil modeled as a
homogeneous medium. In order to validate the soil moisture estimates, soil samples
for gravimetric measurements were taken in 31 regularly spaced locations across
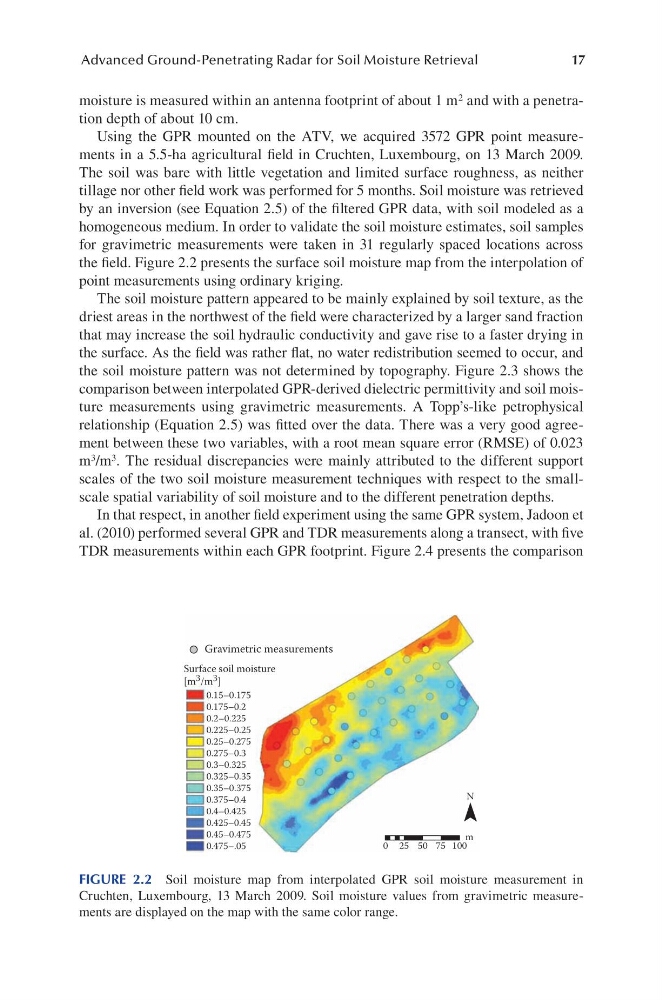
the field. Figure 2.2 presents the surface soil moisture map from the interpolation of
point measurements using ordinary kriging.
The soil moisture pattern appeared to be mainly explained by soil texture, as the
driest areas in the northwest of the field were characterized by a larger sand fraction
that may increase the soil hydraulic conductivity and gave rise to a faster drying in
the surface. As the field was rather flat, no water redistribution seemed to occur, and
the soil moisture pattern was not determined by topography. Figure 2.3 shows the
comparison between interpolated GPR-derived dielectric permittivity and soil moisture measurements using gravimetric measurements. A Topp’s-like petrophysical
relationship (Equation 2.5) was fitted over the data. There was a very good agreement between these two variables, with a root mean square error (RMSE) of 0.023
m 3 /m 3 . The residual discrepancies were mainly attributed to the different support
scales of the two soil moisture measurement techniques with respect to the smallscale spatial variability of soil moisture and to the different penetration depths.
In that respect, in another field experiment using the same GPR system, Jadoon et
al. (2010) performed several GPR and TDR measurements along a transect, with five
TDR measurements within each GPR footprint. Figure 2.4 presents the comparison
Gravimetric measurements
Surface soil moisture
[m 3 /m 3 ]
0.15–0.175
0.175–0.2
0.2–0.225
0.225–0.25
0.25–0.275
0.275–0.3
0.3–0.325
0.325–0.35
0.35–0.375
0.375–0.4
0.4–0.425
0.425–0.45
0.45–0.475
0.475–.05
0 25 50 75 100
m
N
FIGURE 2.2 Soil moisture map from interpolated GPR soil moisture measurement in
Cruchten, Luxembourg, 13 March 2009. Soil moisture values from gravimetric measurements are displayed on the map with the same color range.
Advanced Ground-Penetrating Radar for Soil Moisture Retrieval
moisture is measured within an antenna footprint of about 1 m 2 and with a penetration depth of about 10 cm.
Using the GPR mounted on the ATV, we acquired 3572 GPR point measurements in a 5.5-ha agricultural field in Cruchten, Luxembourg, on 13 March 2009.
The soil was bare with little vegetation and limited surface roughness, as neither
tillage nor other field work was performed for 5 months. Soil moisture was retrieved
by an inversion (see Equation 2.5) of the filtered GPR data, with soil modeled as a
homogeneous medium. In order to validate the soil moisture estimates, soil samples
for gravimetric measurements were taken in 31 regularly spaced locations across
the field. Figure 2.2 presents the surface soil moisture map from the interpolation of
point measurements using ordinary kriging.
The soil moisture pattern appeared to be mainly explained by soil texture, as the
driest areas in the northwest of the field were characterized by a larger sand fraction
that may increase the soil hydraulic conductivity and gave rise to a faster drying in
the surface. As the field was rather flat, no water redistribution seemed to occur, and
the soil moisture pattern was not determined by topography. Figure 2.3 shows the
comparison between interpolated GPR-derived dielectric permittivity and soil moisture measurements using gravimetric measurements. A Topp’s-like petrophysical
relationship (Equation 2.5) was fitted over the data. There was a very good agreement between these two variables, with a root mean square error (RMSE) of 0.023
m 3 /m 3 . The residual discrepancies were mainly attributed to the different support
scales of the two soil moisture measurement techniques with respect to the smallscale spatial variability of soil moisture and to the different penetration depths.
In that respect, in another field experiment using the same GPR system, Jadoon et
al. (2010) performed several GPR and TDR measurements along a transect, with five
TDR measurements within each GPR footprint. Figure 2.4 presents the comparison
Gravimetric measurements
Surface soil moisture
[m 3 /m 3 ]
0.15–0.175
0.175–0.2
0.2–0.225
0.225–0.25
0.25–0.275
0.275–0.3
0.3–0.325
0.325–0.35
0.35–0.375
0.375–0.4
0.4–0.425
0.425–0.45
0.45–0.475
0.475–.05
0 25 50 75 100
m
N
FIGURE 2.2 Soil moisture map from interpolated GPR soil moisture measurement in
Cruchten, Luxembourg, 13 March 2009. Soil moisture values from gravimetric measurements are displayed on the map with the same color range.