

18
Multiscale Hydrologic Remote Sensing: Perspectives and Applications
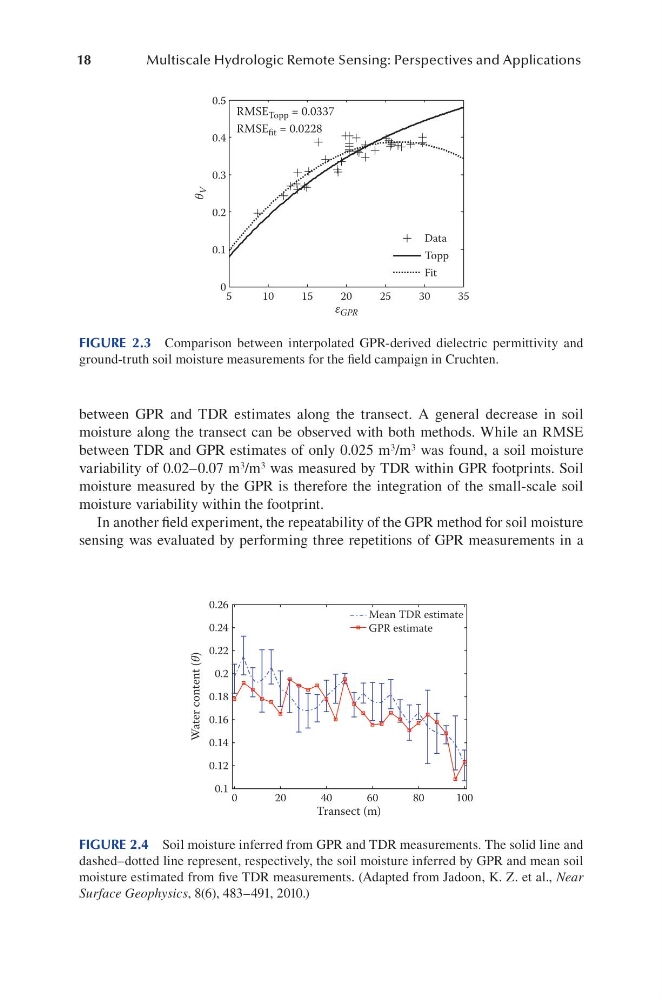
between GPR and TDR estimates along the transect. A general decrease in soil
moisture along the transect can be observed with both methods. While an RMSE
between TDR and GPR estimates of only 0.025 m 3 /m 3 was found, a soil moisture
variability of 0.02–0.07 m 3 /m 3 was measured by TDR within GPR footprints. Soil
moisture measured by the GPR is therefore the integration of the small-scale soil
moisture variability within the footprint.
In another field experiment, the repeatability of the GPR method for soil moisture
sensing was evaluated by performing three repetitions of GPR measurements in a
0.5
0.4
0.3
0.2
0.1
0 5
10
15
20
ε GPR
θ
V
25
30
Data
Topp
Fit
RMSE Topp = 0.0337
RMSE fit = 0.0228
35
FIGURE 2.3 Comparison between interpolated GPR-derived dielectric permittivity and
ground-truth soil moisture measurements for the field campaign in Cruchten.
0.26
0.24
0.22
0.2
0.18
0.16
0.14
0.12
0.1 0
20
40
60
Mean TDR estimate
GPR estimate
80
100
Transect (m)
Water content (θ)
FIGURE 2.4 Soil moisture inferred from GPR and TDR measurements. The solid line and
dashed–dotted line represent, respectively, the soil moisture inferred by GPR and mean soil
moisture estimated from five TDR measurements. (Adapted from Jadoon, K. Z. et al., Near
Surface Geophysics, 8(6), 483–491, 2010.)
Multiscale Hydrologic Remote Sensing: Perspectives and Applications
between GPR and TDR estimates along the transect. A general decrease in soil
moisture along the transect can be observed with both methods. While an RMSE
between TDR and GPR estimates of only 0.025 m 3 /m 3 was found, a soil moisture
variability of 0.02–0.07 m 3 /m 3 was measured by TDR within GPR footprints. Soil
moisture measured by the GPR is therefore the integration of the small-scale soil
moisture variability within the footprint.
In another field experiment, the repeatability of the GPR method for soil moisture
sensing was evaluated by performing three repetitions of GPR measurements in a
0.5
0.4
0.3
0.2
0.1
0 5
10
15
20
ε GPR
θ
V
25
30
Data
Topp
Fit
RMSE Topp = 0.0337
RMSE fit = 0.0228
35
FIGURE 2.3 Comparison between interpolated GPR-derived dielectric permittivity and
ground-truth soil moisture measurements for the field campaign in Cruchten.
0.26
0.24
0.22
0.2
0.18
0.16
0.14
0.12
0.1 0
20
40
60
Mean TDR estimate
GPR estimate
80
100
Transect (m)
Water content (θ)
FIGURE 2.4 Soil moisture inferred from GPR and TDR measurements. The solid line and
dashed–dotted line represent, respectively, the soil moisture inferred by GPR and mean soil
moisture estimated from five TDR measurements. (Adapted from Jadoon, K. Z. et al., Near
Surface Geophysics, 8(6), 483–491, 2010.)