

293
Precipitation Estimate Using NEXRAD Ground-Based Radar Images
GA. Daily precipitation records from 5 years were collected from 15 rain gauges in
this study area. The annual areal mean precipitation amounts were 1045.4, 1132.23,
1203.57, 871.24, and 891.92 mm for 2002, 2003, 2004, 2006, and 2007, respectively.
Both a wet year (2004) and dry years (2006 and 2007) were included in the analysis.
12.5.2 oveRall aSSeSSMent of nexRad PRoductS
Coefficients D rain and D no-rain were calculated using the entire test data set to assess
the ability of NEXRAD to detect rain presence and absence. The 5 years of daily
data at 15 gauge stations resulted in 27,390 pairs of gauge-radar observations available for analysis. Of these pairs, 27,105 were used after excluding pairs with missing values. The calculated D rain and D no-rain were 82.8 and 95.6, respectively. These
values show that NEXRAD data performed better for detecting no-rain events than
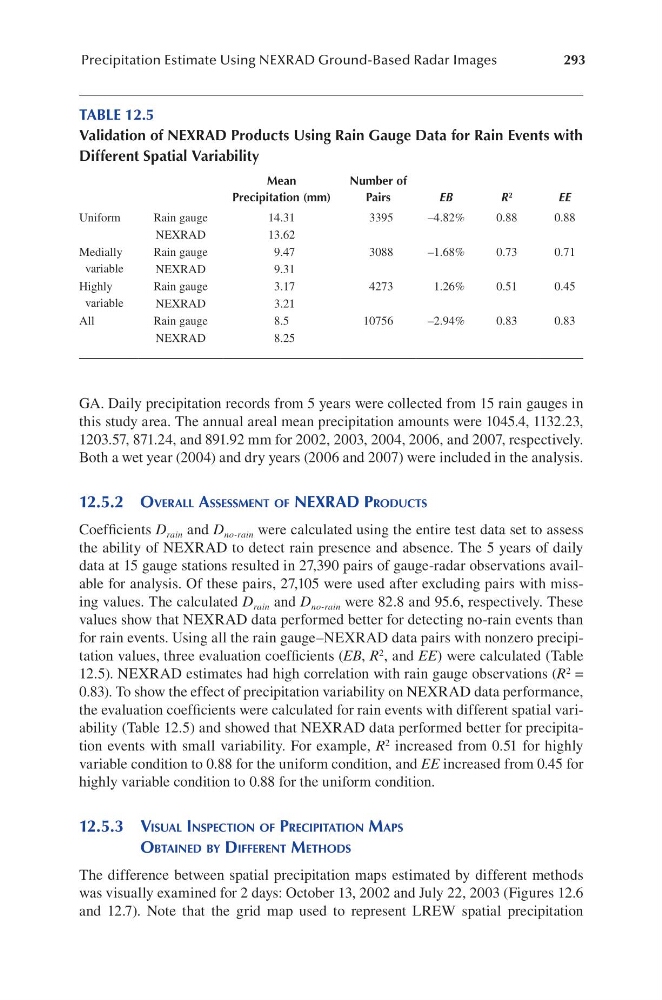
for rain events. Using all the rain gauge–NEXRAD data pairs with nonzero precipitation values, three evaluation coefficients (EB, R 2 , and EE) were calculated (Table
12.5). NEXRAD estimates had high correlation with rain gauge observations (R 2 =
0.83). To show the effect of precipitation variability on NEXRAD data performance,
the evaluation coefficients were calculated for rain events with different spatial variability (Table 12.5) and showed that NEXRAD data performed better for precipitation events with small variability. For example, R 2 increased from 0.51 for highly
variable condition to 0.88 for the uniform condition, and EE increased from 0.45 for
highly variable condition to 0.88 for the uniform condition.
12.5.3 viSual inSPection of PReciPitation MaPS
oBtained By diffeRent MethodS
The difference between spatial precipitation maps estimated by different methods
was visually examined for 2 days: October 13, 2002 and July 22, 2003 (Figures 12.6
and 12.7). Note that the grid map used to represent LREW spatial precipitation
TABLE 12.5
Validation of NEXRAD Products Using Rain Gauge Data for Rain Events with
Different Spatial Variability
Mean
Precipitation (mm)
Number of
Pairs
EB
r 2
EE
Uniform
Rain gauge
14.31
3395
–4.82%
0.88
0.88
NEXRAD
13.62
Medially
variable
Rain gauge
9.47
3088
–1.68%
0.73
0.71
NEXRAD
9.31
Highly
variable
Rain gauge
3.17
4273
1.26%
0.51
0.45
NEXRAD
3.21
All
Rain gauge
8.5
10756
–2.94%
0.83
0.83
NEXRAD
8.25
Precipitation Estimate Using NEXRAD Ground-Based Radar Images
GA. Daily precipitation records from 5 years were collected from 15 rain gauges in
this study area. The annual areal mean precipitation amounts were 1045.4, 1132.23,
1203.57, 871.24, and 891.92 mm for 2002, 2003, 2004, 2006, and 2007, respectively.
Both a wet year (2004) and dry years (2006 and 2007) were included in the analysis.
12.5.2 oveRall aSSeSSMent of nexRad PRoductS
Coefficients D rain and D no-rain were calculated using the entire test data set to assess
the ability of NEXRAD to detect rain presence and absence. The 5 years of daily
data at 15 gauge stations resulted in 27,390 pairs of gauge-radar observations available for analysis. Of these pairs, 27,105 were used after excluding pairs with missing values. The calculated D rain and D no-rain were 82.8 and 95.6, respectively. These
values show that NEXRAD data performed better for detecting no-rain events than
for rain events. Using all the rain gauge–NEXRAD data pairs with nonzero precipitation values, three evaluation coefficients (EB, R 2 , and EE) were calculated (Table
12.5). NEXRAD estimates had high correlation with rain gauge observations (R 2 =
0.83). To show the effect of precipitation variability on NEXRAD data performance,
the evaluation coefficients were calculated for rain events with different spatial variability (Table 12.5) and showed that NEXRAD data performed better for precipitation events with small variability. For example, R 2 increased from 0.51 for highly
variable condition to 0.88 for the uniform condition, and EE increased from 0.45 for
highly variable condition to 0.88 for the uniform condition.
12.5.3 viSual inSPection of PReciPitation MaPS
oBtained By diffeRent MethodS
The difference between spatial precipitation maps estimated by different methods
was visually examined for 2 days: October 13, 2002 and July 22, 2003 (Figures 12.6
and 12.7). Note that the grid map used to represent LREW spatial precipitation
TABLE 12.5
Validation of NEXRAD Products Using Rain Gauge Data for Rain Events with
Different Spatial Variability
Mean
Precipitation (mm)
Number of
Pairs
EB
r 2
EE
Uniform
Rain gauge
14.31
3395
–4.82%
0.88
0.88
NEXRAD
13.62
Medially
variable
Rain gauge
9.47
3088
–1.68%
0.73
0.71
NEXRAD
9.31
Highly
variable
Rain gauge
3.17
4273
1.26%
0.51
0.45
NEXRAD
3.21
All
Rain gauge
8.5
10756
–2.94%
0.83
0.83
NEXRAD
8.25