

292
Multiscale Hydrologic Remote Sensing: Perspectives and Applications
BA, SKlm, and RK. Cross validation, a common method used to evaluate the prediction performance of spatial interpolation methods (Isaaks and Srivastava 1989), was
applied to compare the performance of various methods for calibrating NEXRAD
products using rain gauge data. In the procedure, data from each of the rain gauges
are temporarily removed one gauge at a time, and the remaining data are used to estimate the value of the deleted datum. For each time step, we estimated precipitation
at each of the 15 rain gauges using the observed precipitation of the surrounding rain
gauges and compared the estimates with rain gauge observations. This method is
the so-called leave-one-out cross validation, which is computationally intensive but
can provide more accurate model evaluation than other split-sample cross-validation
schemes (Kohavi 1995; Zhang et al. 2009).
12.5.1 little RiveR exPeRiMental wateRShed (lRew)
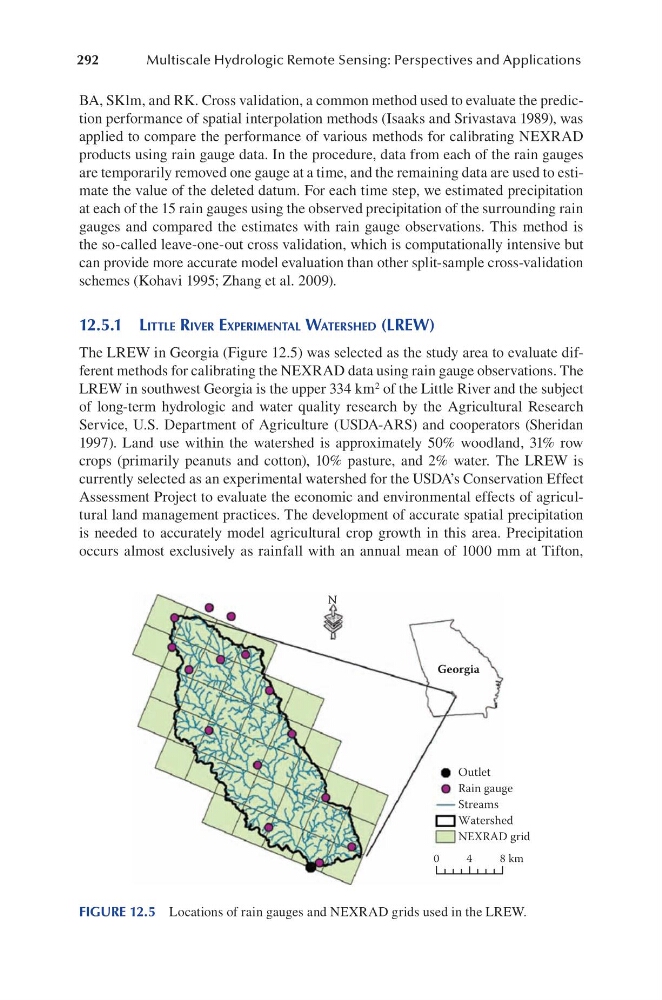
The LREW in Georgia (Figure 12.5) was selected as the study area to evaluate different methods for calibrating the NEXRAD data using rain gauge observations. The
LREW in southwest Georgia is the upper 334 km 2 of the Little River and the subject
of long-term hydrologic and water quality research by the Agricultural Research
Service, U.S. Department of Agriculture (USDA-ARS) and cooperators (Sheridan
1997). Land use within the watershed is approximately 50% woodland, 31% row
crops (primarily peanuts and cotton), 10% pasture, and 2% water. The LREW is
currently selected as an experimental watershed for the USDA’s Conservation Effect
Assessment Project to evaluate the economic and environmental effects of agricultural land management practices. The development of accurate spatial precipitation
is needed to accurately model agricultural crop growth in this area. Precipitation
occurs almost exclusively as rainfall with an annual mean of 1000 mm at Tifton,
Georgia
Outlet
Rain gauge
Streams
Watershed
NEXRAD grid
0
4
8 km
N
FIGURE 12.5 Locations of rain gauges and NEXRAD grids used in the LREW.
Multiscale Hydrologic Remote Sensing: Perspectives and Applications
BA, SKlm, and RK. Cross validation, a common method used to evaluate the prediction performance of spatial interpolation methods (Isaaks and Srivastava 1989), was
applied to compare the performance of various methods for calibrating NEXRAD
products using rain gauge data. In the procedure, data from each of the rain gauges
are temporarily removed one gauge at a time, and the remaining data are used to estimate the value of the deleted datum. For each time step, we estimated precipitation
at each of the 15 rain gauges using the observed precipitation of the surrounding rain
gauges and compared the estimates with rain gauge observations. This method is
the so-called leave-one-out cross validation, which is computationally intensive but
can provide more accurate model evaluation than other split-sample cross-validation
schemes (Kohavi 1995; Zhang et al. 2009).
12.5.1 little RiveR exPeRiMental wateRShed (lRew)
The LREW in Georgia (Figure 12.5) was selected as the study area to evaluate different methods for calibrating the NEXRAD data using rain gauge observations. The
LREW in southwest Georgia is the upper 334 km 2 of the Little River and the subject
of long-term hydrologic and water quality research by the Agricultural Research
Service, U.S. Department of Agriculture (USDA-ARS) and cooperators (Sheridan
1997). Land use within the watershed is approximately 50% woodland, 31% row
crops (primarily peanuts and cotton), 10% pasture, and 2% water. The LREW is
currently selected as an experimental watershed for the USDA’s Conservation Effect
Assessment Project to evaluate the economic and environmental effects of agricultural land management practices. The development of accurate spatial precipitation
is needed to accurately model agricultural crop growth in this area. Precipitation
occurs almost exclusively as rainfall with an annual mean of 1000 mm at Tifton,
Georgia
Outlet
Rain gauge
Streams
Watershed
NEXRAD grid
0
4
8 km
N
FIGURE 12.5 Locations of rain gauges and NEXRAD grids used in the LREW.