

291
Precipitation Estimate Using NEXRAD Ground-Based Radar Images
performance and emphasize the importance of using high-density rain gauge network to evaluate NEXRAD performance.
12.4.4 nexRad PeRfoRMance foR houRly and daily teMPoRal ScaleS
Hourly NEXRAD products are valuable for flood forecasting. Hourly precipitation
from different sources for September 6, 2004 (Figure 12.4) was analyzed using daily
precipitation aggregated from hourly NEXRAD estimates. This aggregation may
cancel out errors at an hourly time scale. To provide insight into NEXRAD performance at an hourly time scale, the evaluation coefficients were also calculated using
hourly NEXRAD data in 2003 and 2004. Due to the difficulty of obtaining hourly
rain gauge data for the mountainous grid, only the G grid is assessed here. Note that
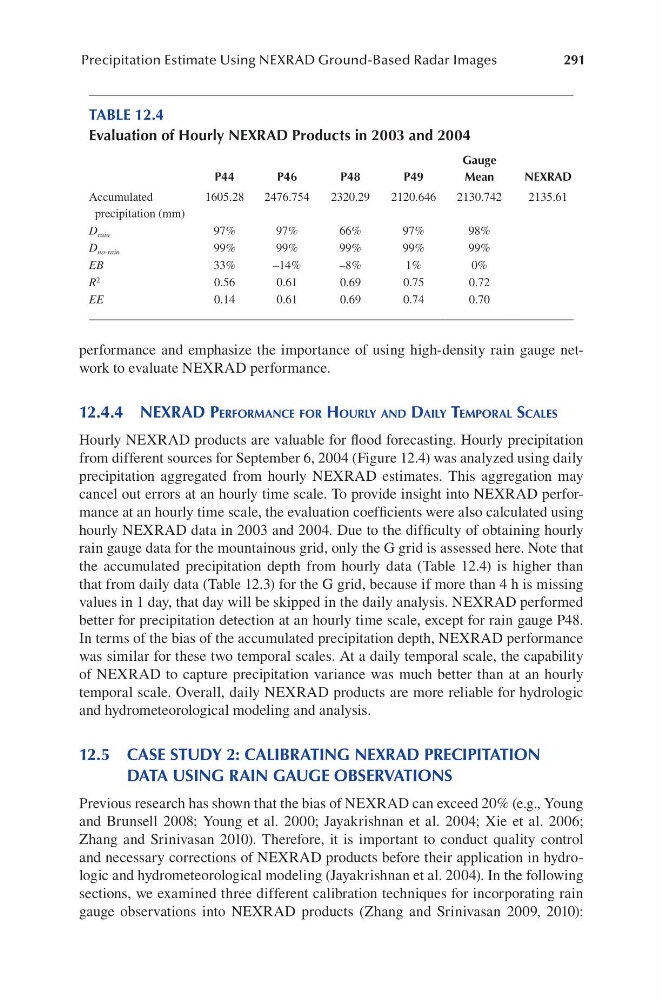
the accumulated precipitation depth from hourly data (Table 12.4) is higher than
that from daily data (Table 12.3) for the G grid, because if more than 4 h is missing
values in 1 day, that day will be skipped in the daily analysis. NEXRAD performed
better for precipitation detection at an hourly time scale, except for rain gauge P48.
In terms of the bias of the accumulated precipitation depth, NEXRAD performance
was similar for these two temporal scales. At a daily temporal scale, the capability
of NEXRAD to capture precipitation variance was much better than at an hourly
temporal scale. Overall, daily NEXRAD products are more reliable for hydrologic
and hydrometeorological modeling and analysis.
12.5 CASE STUDY 2: CALIBRATING NEXRAD PRECIPITATION
DATA USING RAIN GAUGE OBSERVATIONS
Previous research has shown that the bias of NEXRAD can exceed 20% (e.g., Young
and Brunsell 2008; Young et al. 2000; Jayakrishnan et al. 2004; Xie et al. 2006;
Zhang and Srinivasan 2010). Therefore, it is important to conduct quality control
and necessary corrections of NEXRAD products before their application in hydrologic and hydrometeorological modeling (Jayakrishnan et al. 2004). In the following
sections, we examined three different calibration techniques for incorporating rain
gauge observations into NEXRAD products (Zhang and Srinivasan 2009, 2010):
TABLE 12.4
Evaluation of Hourly NEXRAD Products in 2003 and 2004
P44
P46
P48
P49
Gauge
Mean
NEXRAD
Accumulated
precipitation (mm)
1605.28
2476.754
2320.29
2120.646
2130.742
2135.61
D rain
97%
97%
66%
97%
98%
D no-rain
99%
99%
99%
99%
99%
EB
33%
–14%
–8%
1%
0%
R 2
0.56
0.61
0.69
0.75
0.72
EE
0.14
0.61
0.69
0.74
0.70
Precipitation Estimate Using NEXRAD Ground-Based Radar Images
performance and emphasize the importance of using high-density rain gauge network to evaluate NEXRAD performance.
12.4.4 nexRad PeRfoRMance foR houRly and daily teMPoRal ScaleS
Hourly NEXRAD products are valuable for flood forecasting. Hourly precipitation
from different sources for September 6, 2004 (Figure 12.4) was analyzed using daily
precipitation aggregated from hourly NEXRAD estimates. This aggregation may
cancel out errors at an hourly time scale. To provide insight into NEXRAD performance at an hourly time scale, the evaluation coefficients were also calculated using
hourly NEXRAD data in 2003 and 2004. Due to the difficulty of obtaining hourly
rain gauge data for the mountainous grid, only the G grid is assessed here. Note that
the accumulated precipitation depth from hourly data (Table 12.4) is higher than
that from daily data (Table 12.3) for the G grid, because if more than 4 h is missing
values in 1 day, that day will be skipped in the daily analysis. NEXRAD performed
better for precipitation detection at an hourly time scale, except for rain gauge P48.
In terms of the bias of the accumulated precipitation depth, NEXRAD performance
was similar for these two temporal scales. At a daily temporal scale, the capability
of NEXRAD to capture precipitation variance was much better than at an hourly
temporal scale. Overall, daily NEXRAD products are more reliable for hydrologic
and hydrometeorological modeling and analysis.
12.5 CASE STUDY 2: CALIBRATING NEXRAD PRECIPITATION
DATA USING RAIN GAUGE OBSERVATIONS
Previous research has shown that the bias of NEXRAD can exceed 20% (e.g., Young
and Brunsell 2008; Young et al. 2000; Jayakrishnan et al. 2004; Xie et al. 2006;
Zhang and Srinivasan 2010). Therefore, it is important to conduct quality control
and necessary corrections of NEXRAD products before their application in hydrologic and hydrometeorological modeling (Jayakrishnan et al. 2004). In the following
sections, we examined three different calibration techniques for incorporating rain
gauge observations into NEXRAD products (Zhang and Srinivasan 2009, 2010):
TABLE 12.4
Evaluation of Hourly NEXRAD Products in 2003 and 2004
P44
P46
P48
P49
Gauge
Mean
NEXRAD
Accumulated
precipitation (mm)
1605.28
2476.754
2320.29
2120.646
2130.742
2135.61
D rain
97%
97%
66%
97%
98%
D no-rain
99%
99%
99%
99%
99%
EB
33%
–14%
–8%
1%
0%
R 2
0.56
0.61
0.69
0.75
0.72
EE
0.14
0.61
0.69
0.74
0.70