

290
Multiscale Hydrologic Remote Sensing: Perspectives and Applications
variable precipitation events and further to 0.0–0.1 for highly variable precipitation
events. In comparison to precipitation events that are medially or highly variable, the
other evaluation coefficients also confirm that NEXRAD performs equally or better
for uniform precipitation events. A similar trend of NEXRAD performance over
precipitation events with different variability is observed in the G grid. From uniform condition, the bias of NEXRAD precipitation is very small, ranging from −9%
to 2%. For medially variable and highly variable precipitation events, the EB values
are −20%–52% and 3%–80%, respectively. Further analysis of the other evaluation
coefficients shows a similar trend. A possible reason for the elevated performance of
NEXRAD data for uniform precipitation events is that capturing rainfall variability
within the 4 × 4 km 2 NEXRAD grid for highly variable precipitation events is difficult, therefore leading to an unrealistic estimation of mean precipitation.
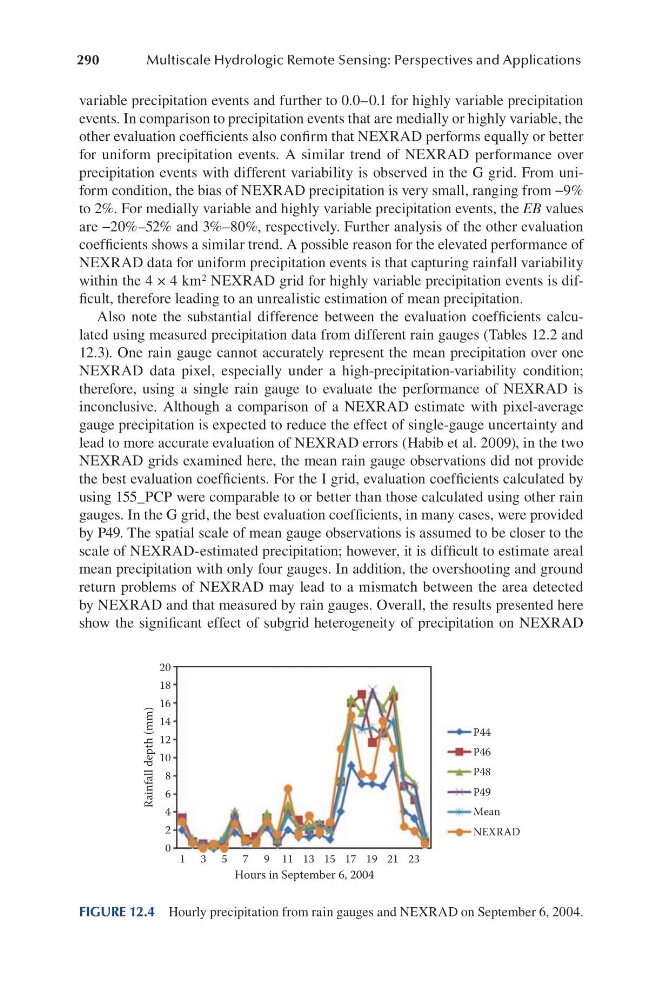
Also note the substantial difference between the evaluation coefficients calculated using measured precipitation data from different rain gauges (Tables 12.2 and
12.3). One rain gauge cannot accurately represent the mean precipitation over one
NEXRAD data pixel, especially under a high-precipitation-variability condition;
therefore, using a single rain gauge to evaluate the performance of NEXRAD is
inconclusive. Although a comparison of a NEXRAD estimate with pixel-average
gauge precipitation is expected to reduce the effect of single-gauge uncertainty and
lead to more accurate evaluation of NEXRAD errors (Habib et al. 2009), in the two
NEXRAD grids examined here, the mean rain gauge observations did not provide
the best evaluation coefficients. For the I grid, evaluation coefficients calculated by
using 155_PCP were comparable to or better than those calculated using other rain
gauges. In the G grid, the best evaluation coefficients, in many cases, were provided
by P49. The spatial scale of mean gauge observations is assumed to be closer to the
scale of NEXRAD-estimated precipitation; however, it is difficult to estimate areal
mean precipitation with only four gauges. In addition, the overshooting and ground
return problems of NEXRAD may lead to a mismatch between the area detected
by NEXRAD and that measured by rain gauges. Overall, the results presented here
show the significant effect of subgrid heterogeneity of precipitation on NEXRAD
20
18
16
14
12
10
8
6
4
2
0
1 3 5 7 9 11 13 15 17 19 21 23
Hours in September 6, 2004
Rainfall depth (mm)
P44
P46
P48
P49
Mean
NEXRAD
FIGURE 12.4 Hourly precipitation from rain gauges and NEXRAD on September 6, 2004.
Multiscale Hydrologic Remote Sensing: Perspectives and Applications
variable precipitation events and further to 0.0–0.1 for highly variable precipitation
events. In comparison to precipitation events that are medially or highly variable, the
other evaluation coefficients also confirm that NEXRAD performs equally or better
for uniform precipitation events. A similar trend of NEXRAD performance over
precipitation events with different variability is observed in the G grid. From uniform condition, the bias of NEXRAD precipitation is very small, ranging from −9%
to 2%. For medially variable and highly variable precipitation events, the EB values
are −20%–52% and 3%–80%, respectively. Further analysis of the other evaluation
coefficients shows a similar trend. A possible reason for the elevated performance of
NEXRAD data for uniform precipitation events is that capturing rainfall variability
within the 4 × 4 km 2 NEXRAD grid for highly variable precipitation events is difficult, therefore leading to an unrealistic estimation of mean precipitation.
Also note the substantial difference between the evaluation coefficients calculated using measured precipitation data from different rain gauges (Tables 12.2 and
12.3). One rain gauge cannot accurately represent the mean precipitation over one
NEXRAD data pixel, especially under a high-precipitation-variability condition;
therefore, using a single rain gauge to evaluate the performance of NEXRAD is
inconclusive. Although a comparison of a NEXRAD estimate with pixel-average
gauge precipitation is expected to reduce the effect of single-gauge uncertainty and
lead to more accurate evaluation of NEXRAD errors (Habib et al. 2009), in the two
NEXRAD grids examined here, the mean rain gauge observations did not provide
the best evaluation coefficients. For the I grid, evaluation coefficients calculated by
using 155_PCP were comparable to or better than those calculated using other rain
gauges. In the G grid, the best evaluation coefficients, in many cases, were provided
by P49. The spatial scale of mean gauge observations is assumed to be closer to the
scale of NEXRAD-estimated precipitation; however, it is difficult to estimate areal
mean precipitation with only four gauges. In addition, the overshooting and ground
return problems of NEXRAD may lead to a mismatch between the area detected
by NEXRAD and that measured by rain gauges. Overall, the results presented here
show the significant effect of subgrid heterogeneity of precipitation on NEXRAD
20
18
16
14
12
10
8
6
4
2
0
1 3 5 7 9 11 13 15 17 19 21 23
Hours in September 6, 2004
Rainfall depth (mm)
P44
P46
P48
P49
Mean
NEXRAD
FIGURE 12.4 Hourly precipitation from rain gauges and NEXRAD on September 6, 2004.