

294
Multiscale Hydrologic Remote Sensing: Perspectives and Applications
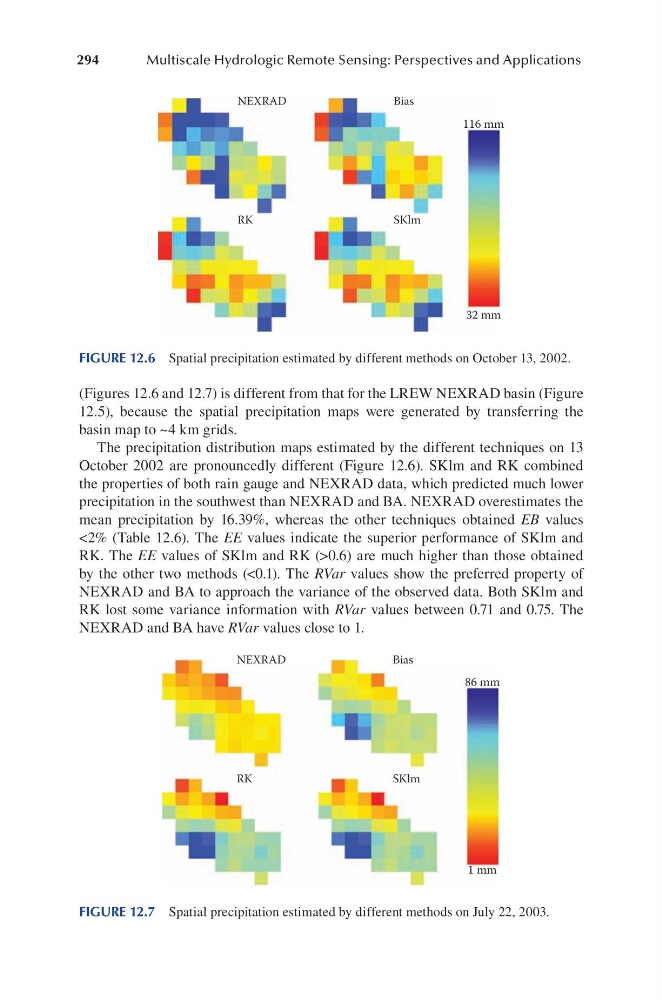
(Figures 12.6 and 12.7) is different from that for the LREW NEXRAD basin (Figure
12.5), because the spatial precipitation maps were generated by transferring the
basin map to ~4 km grids.
The precipitation distribution maps estimated by the different techniques on 13
October 2002 are pronouncedly different (Figure 12.6). SKlm and RK combined
the properties of both rain gauge and NEXRAD data, which predicted much lower
precipitation in the southwest than NEXRAD and BA. NEXRAD overestimates the
mean precipitation by 16.39%, whereas the other techniques obtained EB values
<2% (Table 12.6). The EE values indicate the superior performance of SKlm and
RK. The EE values of SKlm and RK (>0.6) are much higher than those obtained
by the other two methods (<0.1). The RVar values show the preferred property of
NEXRAD and BA to approach the variance of the observed data. Both SKlm and
RK lost some variance information with RVar values between 0.71 and 0.75. The
NEXRAD and BA have RVar values close to 1.
116 mm
32 mm
NEXRAD
Bias
RK
SKlm
FIGURE 12.6 Spatial precipitation estimated by different methods on October 13, 2002.
86 mm
1 mm
NEXRAD
Bias
RK
SKlm
FIGURE 12.7 Spatial precipitation estimated by different methods on July 22, 2003.
Multiscale Hydrologic Remote Sensing: Perspectives and Applications
(Figures 12.6 and 12.7) is different from that for the LREW NEXRAD basin (Figure
12.5), because the spatial precipitation maps were generated by transferring the
basin map to ~4 km grids.
The precipitation distribution maps estimated by the different techniques on 13
October 2002 are pronouncedly different (Figure 12.6). SKlm and RK combined
the properties of both rain gauge and NEXRAD data, which predicted much lower
precipitation in the southwest than NEXRAD and BA. NEXRAD overestimates the
mean precipitation by 16.39%, whereas the other techniques obtained EB values
<2% (Table 12.6). The EE values indicate the superior performance of SKlm and
RK. The EE values of SKlm and RK (>0.6) are much higher than those obtained
by the other two methods (<0.1). The RVar values show the preferred property of
NEXRAD and BA to approach the variance of the observed data. Both SKlm and
RK lost some variance information with RVar values between 0.71 and 0.75. The
NEXRAD and BA have RVar values close to 1.
116 mm
32 mm
NEXRAD
Bias
RK
SKlm
FIGURE 12.6 Spatial precipitation estimated by different methods on October 13, 2002.
86 mm
1 mm
NEXRAD
Bias
RK
SKlm
FIGURE 12.7 Spatial precipitation estimated by different methods on July 22, 2003.