

179
Modeling Stream Flow Changes
8.4.4 outPut of ann Modeling analySiS
The historical discharge record was based on the hydrologic station at Dashankou. In
this analysis, 70% of samples were used for training and the remaining 15% for validation. The ANN modeling work is generalized to stop training before overfitting
can occur. The training stopped at iteration 9 when the validation error increased.
According to the results, no significant overfitting occurred. The final mean squared
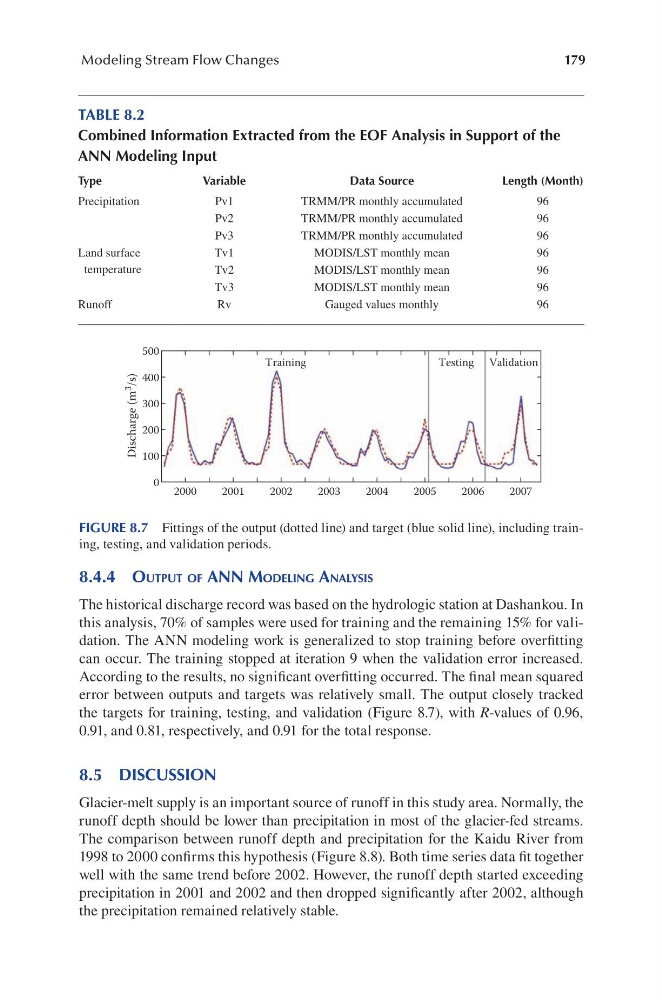
error between outputs and targets was relatively small. The output closely tracked
the targets for training, testing, and validation (Figure 8.7), with R-values of 0.96,
0.91, and 0.81, respectively, and 0.91 for the total response.
8.5 DISCUSSION
Glacier-melt supply is an important source of runoff in this study area. Normally, the
runoff depth should be lower than precipitation in most of the glacier-fed streams.
The comparison between runoff depth and precipitation for the Kaidu River from
1998 to 2000 confirms this hypothesis (Figure 8.8). Both time series data fit together
well with the same trend before 2002. However, the runoff depth started exceeding
precipitation in 2001 and 2002 and then dropped significantly after 2002, although
the precipitation remained relatively stable.
500
400
300
200
100
0 2000
2001
2002
Training
Discharge (m 3
/s)
Testing Validation
2003
2004
2005
2006
2007
FIGURE 8.7 Fittings of the output (dotted line) and target (blue solid line), including training, testing, and validation periods.
TABLE 8.2
Combined Information Extracted from the EOF Analysis in Support of the
ANN Modeling Input
Type
Variable
Data Source
Length (Month)
Precipitation
Pv1
TRMM/PR monthly accumulated
96
Pv2
TRMM/PR monthly accumulated
96
Pv3
TRMM/PR monthly accumulated
96
Land surface
temperature
Tv1
MODIS/LST monthly mean
96
Tv2
MODIS/LST monthly mean
96
Tv3
MODIS/LST monthly mean
96
Runoff
Rv
Gauged values monthly
96
Modeling Stream Flow Changes
8.4.4 outPut of ann Modeling analySiS
The historical discharge record was based on the hydrologic station at Dashankou. In
this analysis, 70% of samples were used for training and the remaining 15% for validation. The ANN modeling work is generalized to stop training before overfitting
can occur. The training stopped at iteration 9 when the validation error increased.
According to the results, no significant overfitting occurred. The final mean squared
error between outputs and targets was relatively small. The output closely tracked
the targets for training, testing, and validation (Figure 8.7), with R-values of 0.96,
0.91, and 0.81, respectively, and 0.91 for the total response.
8.5 DISCUSSION
Glacier-melt supply is an important source of runoff in this study area. Normally, the
runoff depth should be lower than precipitation in most of the glacier-fed streams.
The comparison between runoff depth and precipitation for the Kaidu River from
1998 to 2000 confirms this hypothesis (Figure 8.8). Both time series data fit together
well with the same trend before 2002. However, the runoff depth started exceeding
precipitation in 2001 and 2002 and then dropped significantly after 2002, although
the precipitation remained relatively stable.
500
400
300
200
100
0 2000
2001
2002
Training
Discharge (m 3
/s)
Testing Validation
2003
2004
2005
2006
2007
FIGURE 8.7 Fittings of the output (dotted line) and target (blue solid line), including training, testing, and validation periods.
TABLE 8.2
Combined Information Extracted from the EOF Analysis in Support of the
ANN Modeling Input
Type
Variable
Data Source
Length (Month)
Precipitation
Pv1
TRMM/PR monthly accumulated
96
Pv2
TRMM/PR monthly accumulated
96
Pv3
TRMM/PR monthly accumulated
96
Land surface
temperature
Tv1
MODIS/LST monthly mean
96
Tv2
MODIS/LST monthly mean
96
Tv3
MODIS/LST monthly mean
96
Runoff
Rv
Gauged values monthly
96