

178
Multiscale Hydrologic Remote Sensing: Perspectives and Applications
8.4.3 conStRuction of inPut vaRiaBleS foR ann Modeling analySiS
In physics, the EOF can be understood as a spatial standing wave. During the evolution, all spatial variables move up and down but remain in the same spatial structure or position to keep the systematic form. Thus, the changing process could be
measured or substituted by some marked points (e.g., arrows in Figure 8.5), which
largely reduce the intertwined complexity in space and time. In this context, based
on the spatial structures extracted from the EOF analysis, a numerical scheme for
screening all groups of spatial variables was established to pin down the exact locations where the major variance occurs in association with monthly precipitation and
LSTs. These clues guide the location choices for input variables to the ANN model.
All TRMM/PR and MODIS/LST grids can be used as input variables for ANN
modeling to improve the overall accuracy, but this is unnecessary, given that an
ANN model requires a lot of key data to guarantee the credibility of the forecasting
practices and completing successful runs is time consuming (Sha 2007). Hence, we
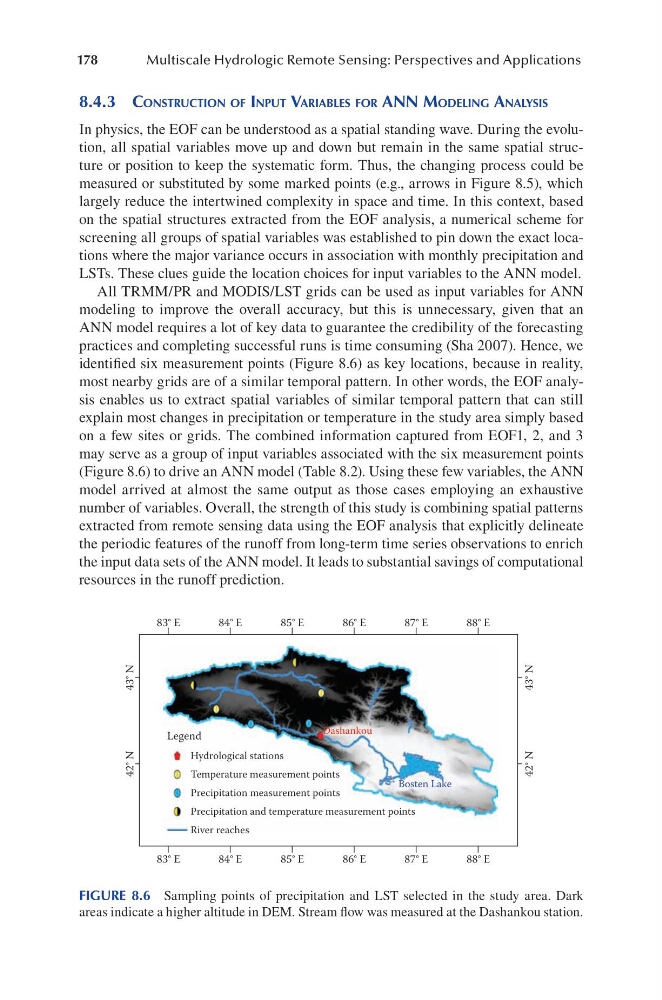
identified six measurement points (Figure 8.6) as key locations, because in reality,
most nearby grids are of a similar temporal pattern. In other words, the EOF analysis enables us to extract spatial variables of similar temporal pattern that can still
explain most changes in precipitation or temperature in the study area simply based
on a few sites or grids. The combined information captured from EOF1, 2, and 3
may serve as a group of input variables associated with the six measurement points
(Figure 8.6) to drive an ANN model (Table 8.2). Using these few variables, the ANN
model arrived at almost the same output as those cases employing an exhaustive
number of variables. Overall, the strength of this study is combining spatial patterns
extracted from remote sensing data using the EOF analysis that explicitly delineate
the periodic features of the runoff from long-term time series observations to enrich
the input data sets of the ANN model. It leads to substantial savings of computational
resources in the runoff prediction.
83° E
43° N
42° N
43° N
42° N
84° E
85° E
86° E
87° E
88° E
83° E
84° E
85° E
86° E
87° E
88° E
Legend
Dashankou
Bosten Lake
Hydrological stations
Temperature measurement points
Precipitation measurement points
Precipitation and temperature measurement points
River reaches
FIGURE 8.6 Sampling points of precipitation and LST selected in the study area. Dark
areas indicate a higher altitude in DEM. Stream flow was measured at the Dashankou station.
Multiscale Hydrologic Remote Sensing: Perspectives and Applications
8.4.3 conStRuction of inPut vaRiaBleS foR ann Modeling analySiS
In physics, the EOF can be understood as a spatial standing wave. During the evolution, all spatial variables move up and down but remain in the same spatial structure or position to keep the systematic form. Thus, the changing process could be
measured or substituted by some marked points (e.g., arrows in Figure 8.5), which
largely reduce the intertwined complexity in space and time. In this context, based
on the spatial structures extracted from the EOF analysis, a numerical scheme for
screening all groups of spatial variables was established to pin down the exact locations where the major variance occurs in association with monthly precipitation and
LSTs. These clues guide the location choices for input variables to the ANN model.
All TRMM/PR and MODIS/LST grids can be used as input variables for ANN
modeling to improve the overall accuracy, but this is unnecessary, given that an
ANN model requires a lot of key data to guarantee the credibility of the forecasting
practices and completing successful runs is time consuming (Sha 2007). Hence, we
identified six measurement points (Figure 8.6) as key locations, because in reality,
most nearby grids are of a similar temporal pattern. In other words, the EOF analysis enables us to extract spatial variables of similar temporal pattern that can still
explain most changes in precipitation or temperature in the study area simply based
on a few sites or grids. The combined information captured from EOF1, 2, and 3
may serve as a group of input variables associated with the six measurement points
(Figure 8.6) to drive an ANN model (Table 8.2). Using these few variables, the ANN
model arrived at almost the same output as those cases employing an exhaustive
number of variables. Overall, the strength of this study is combining spatial patterns
extracted from remote sensing data using the EOF analysis that explicitly delineate
the periodic features of the runoff from long-term time series observations to enrich
the input data sets of the ANN model. It leads to substantial savings of computational
resources in the runoff prediction.
83° E
43° N
42° N
43° N
42° N
84° E
85° E
86° E
87° E
88° E
83° E
84° E
85° E
86° E
87° E
88° E
Legend
Dashankou
Bosten Lake
Hydrological stations
Temperature measurement points
Precipitation measurement points
Precipitation and temperature measurement points
River reaches
FIGURE 8.6 Sampling points of precipitation and LST selected in the study area. Dark
areas indicate a higher altitude in DEM. Stream flow was measured at the Dashankou station.